

Grafana's free Cloud tier, combined with WP-CLI data exports piped into a MySQL or PostgreSQL data source, gives agencies a branded client reporting dashboard that unifies WordPress site performance with social media campaign metrics. The full agency dashboard setup, from account creation through white-labeled embed, takes under 60 minutes.
Why Social Campaign Reporting Keeps Breaking Across Tools
Agencies running social media campaigns alongside WordPress site maintenance face the same fragmented reporting problem: Facebook Ads Manager shows reach and cost-per-click, Instagram Insights shows engagement rate, Google Analytics shows on-site behavior, and the WordPress admin shows plugin updates and uptime data. Clients don't want four logins or four PDFs. They want one screen that answers "what did my money buy this month?" and most agencies solve this by manually copying numbers into a branded Google Slides deck every 30 days. That workflow is slow, error-prone, and scales terribly once you're managing more than about eight accounts.
Tools like WP Client Reports address part of the problem by automatically pulling in statistics from site maintenance, analytics, form submissions, uptime monitoring, and e-commerce into a single WordPress-native report. Platforms like ManageWP and the Automattic for Agencies dashboard offer centralized management, with Automattic's system providing "one central place to manage every client site" according to their documentation. But these tools generally stop at the WordPress boundary. Social media campaign data, the metrics clients care most about if you're running paid or organic social for them, lives in entirely separate systems. The result is a reporting gap that sits right at the point where your two highest-value services (social campaign management and WordPress site delivery) should be proving their combined ROI to clients.
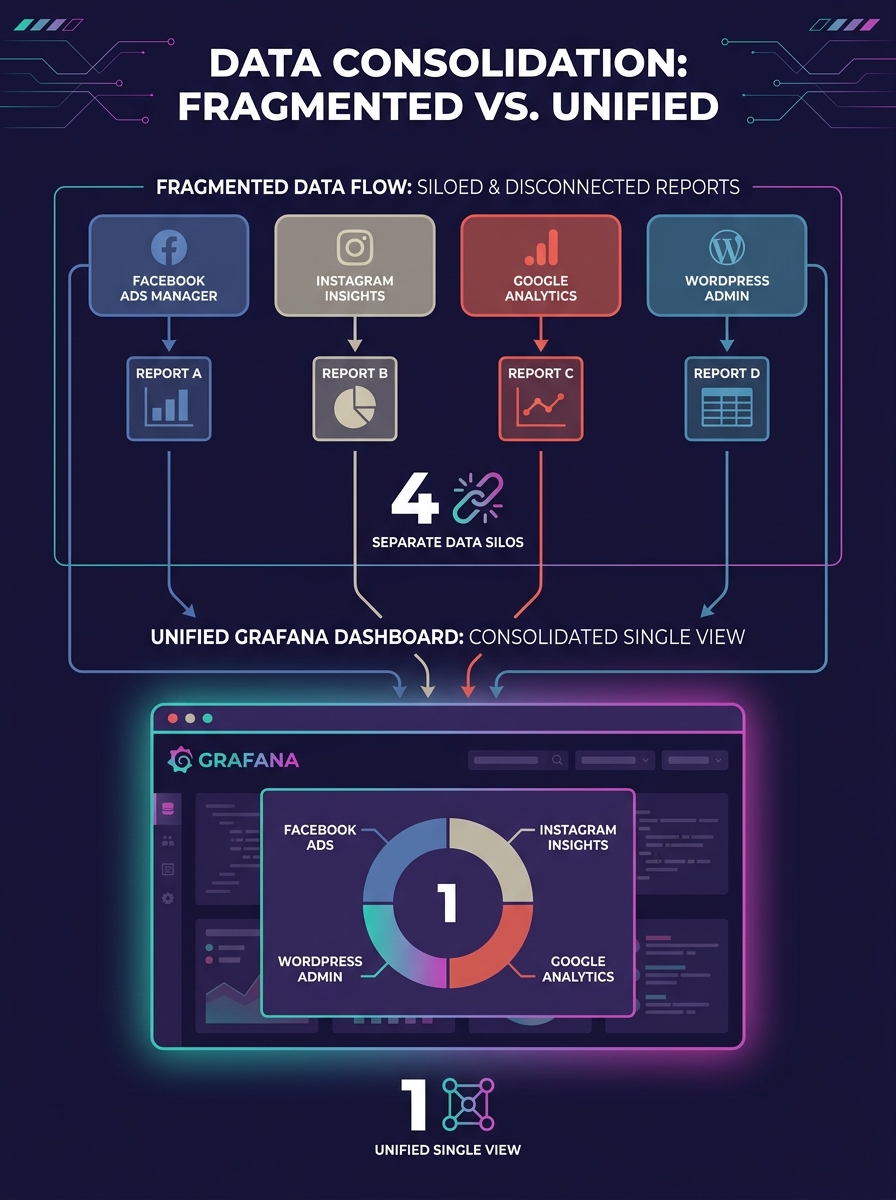
Grafana solves this by acting as a visualization layer that doesn't care where the data originates. It connects to MySQL, PostgreSQL, JSON APIs, CSV files, Prometheus endpoints, and dozens of other data sources simultaneously. The Grafana WordPress statistics dashboard, template ID 20194, already tracks 10 distinct metric categories out of the box: total visitors, top browsers, top 10 referring sites, search engines, visitor geography by country, online users, and visit trends over the last 10 days. Your job is extending that foundation with social campaign data and then branding the whole thing so your agency name never appears.
Wiring WP-CLI Exports and Social Metrics Into Grafana
The technical architecture has three layers: data collection, data storage, and data visualization. WP-CLI handles the first layer for WordPress metrics. A cron job running commands like wp post list, wp plugin list, and wp site health produces structured JSON or CSV output covering posts published, plugins updated, security status, and comment activity across every client site you manage. These scheduled exports land in a MySQL database table that Grafana reads as a native data source. For agencies already thinking about production debugging and observability systems, this data pipeline fits into the same infrastructure pattern. The entire WP-CLI monitoring layer requires a single bash script and a cron schedule, both of which you can template once and deploy to every client server.
The social media layer works differently because the data originates outside your infrastructure. Facebook's Marketing API, Instagram's Graph API, and LinkedIn's Marketing API each return JSON payloads containing impressions, clicks, engagement events, and spend data. A lightweight Python or Node script, running on the same cron schedule as your WP-CLI exports, pulls these payloads and writes them to the same MySQL database. If API integration feels heavy for your team size, the simpler path is exporting CSV reports from each platform's native dashboard and importing them into your database weekly. The trade-off is obvious: automated API pulls give you daily granularity without manual work, while CSV imports cost 15 minutes per client per week but require zero API authentication setup. For agencies managing under 20 social accounts, the CSV path is genuinely fine. Beyond that threshold, the manual time compounds fast enough that API automation pays for itself within the first month.
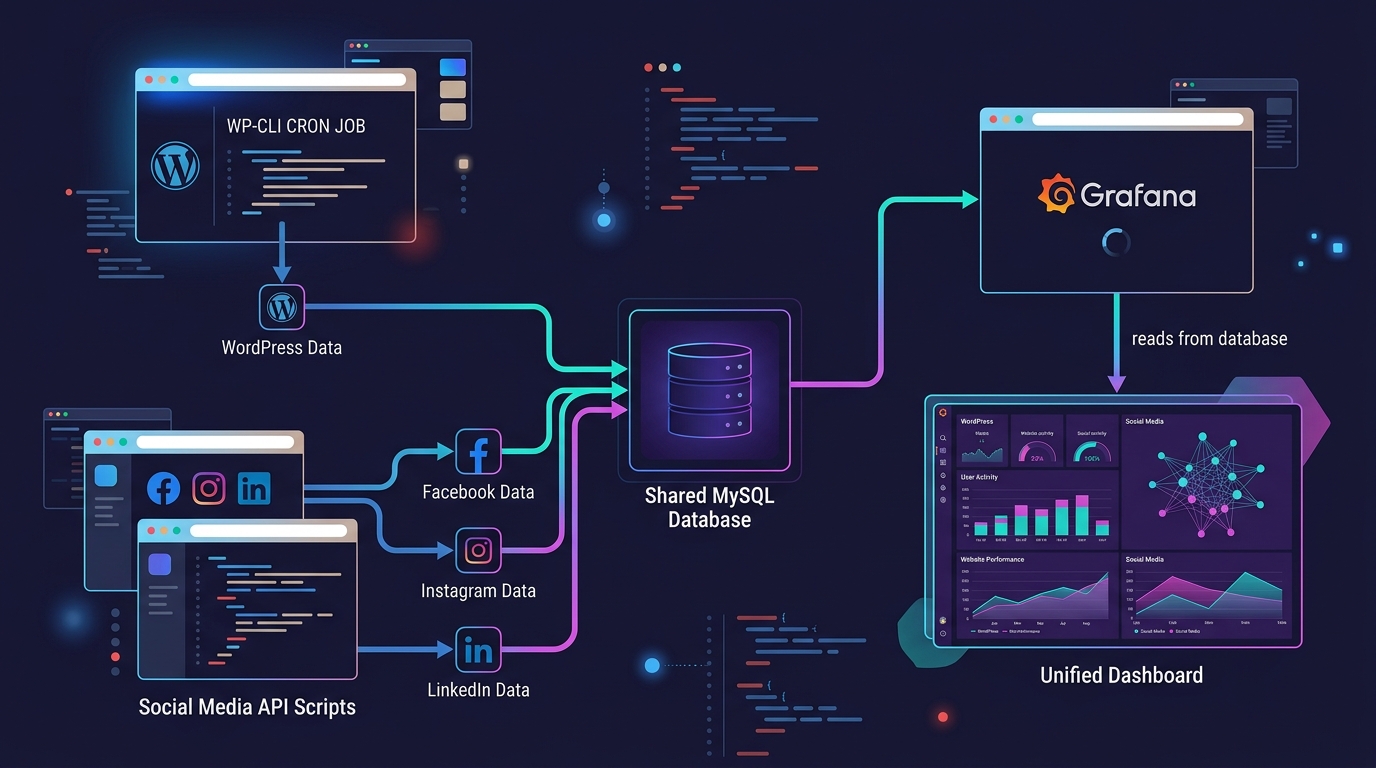
The Grafana side takes about 10 minutes once your data sources exist. You create a new dashboard, add panels for each metric category (WordPress site health in one row, social campaign performance in another, traffic attribution connecting the two in a third), and configure each panel to query your MySQL data source with straightforward SQL. The Grafana community has contributed WordPress-specific dashboard templates that show database status, revision counts, and upload activity through the Prometheus Metrics in WordPress plugin. Importing one of these templates and modifying it to include your social media tables cuts the dashboard creation time significantly. Agencies that have already addressed WordPress performance measurement will find the Grafana panel configuration intuitive because the mental model (define a metric, set a threshold, visualize the trend) is identical.
Branding the Dashboard Until Your Agency Name Disappears
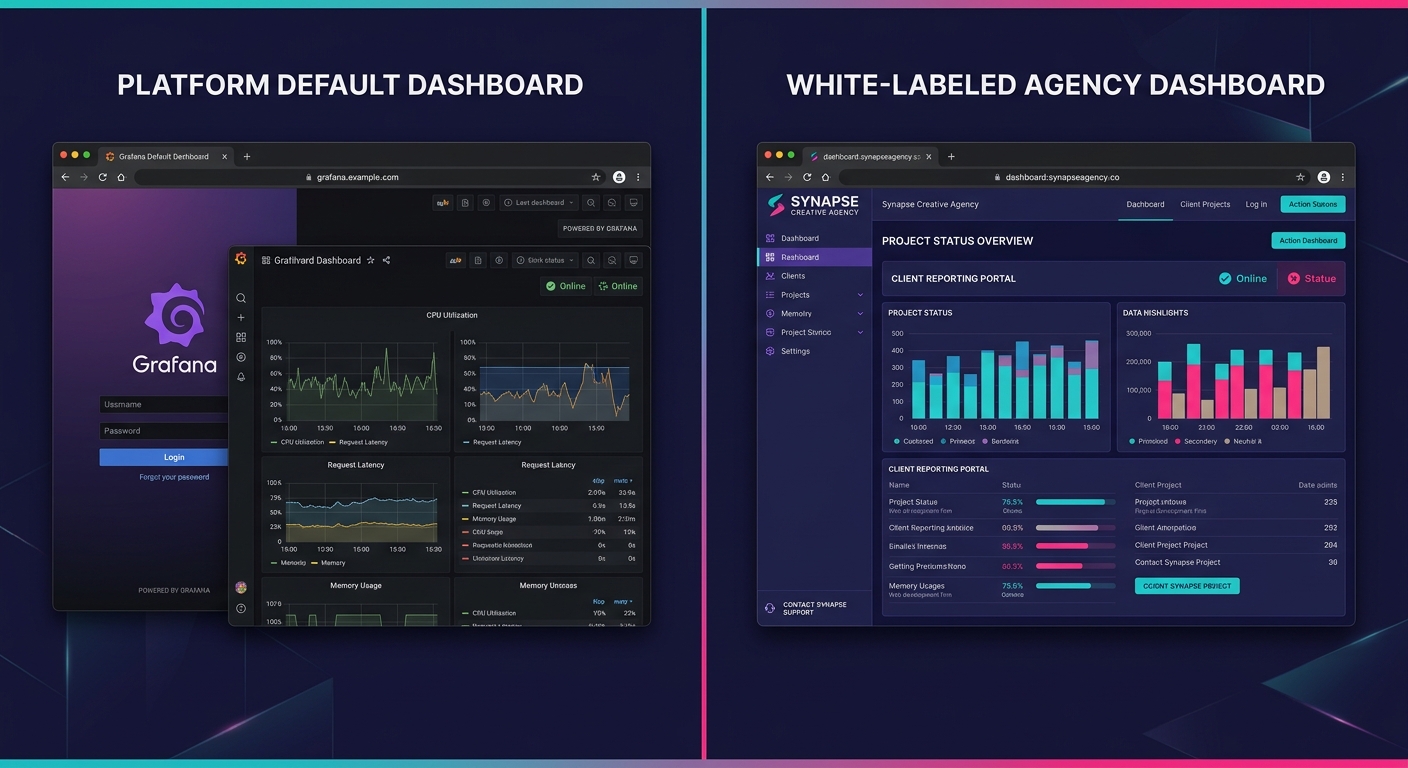
White-label WordPress reporting requires that clients see their own branding or your agency's client-facing brand, never Grafana's purple logo. The approach depends on whether you're running Grafana's Enterprise tier or the open-source self-hosted version. Enterprise customers get clean configuration options for custom branding: app_title, login_title, login_subtitle, login_logo, and login_background are all settable through the grafana.ini file's white_labeling section. You replace Grafana's identity with your agency's in about 5 minutes.
On the open-source tier, the process is scrappier but entirely functional. You replace image files at specific paths: grafana_icon.svg, fav32.png, and optionally the login_background_dark.svg and login_background_light.svg files in the /usr/share/grafana/public/img/ directory. A Clearhat tutorial documents this hack-and-replace approach step by step, noting that "you will hackily replace some or all of these image files, and update text in a few others." The result looks identical to the Enterprise version from the client's perspective. The trade-off is that Grafana updates can overwrite your custom files, so you need a deployment script that re-applies your branding after each update. Store your branded assets in Git, run the replacement script as a post-update hook, and the maintenance burden stays near zero.
For agencies managing multiple white-label partners at scale, the embed approach is cleaner than giving clients direct Grafana logins. Grafana supports iframe embedding with authentication tokens, meaning your client portal (whether it's a custom WordPress dashboard, a branded web app, or even a simple password-protected page) loads the Grafana dashboard inside its own interface. The client never sees a Grafana URL, a Grafana login screen, or any indication that Grafana exists. Their experience is: log into your portal, see their dashboard, review their social campaign metrics next to their WordPress site health data, and walk away understanding what their retainer is buying them.
The client reporting automation piece comes from Grafana's built-in reporting features. You can schedule PDF snapshots of any dashboard and have them emailed to clients on whatever cadence you choose: weekly, biweekly, monthly. Each PDF carries your branding, includes the time range you specify, and arrives in the client's inbox without anyone on your team touching it. For agencies that have already tightened their revision and scope processes, automated reporting closes the last manual loop in the client communication cycle.
The Uncomfortable Part
This setup works well for agencies with some command-line comfort and a willingness to maintain a small piece of custom infrastructure. It does not work well for teams that want a fully managed, click-to-configure solution. The WP-CLI monitoring scripts need writing, the social API connections need maintaining when platforms change their authentication flows (Facebook has done this three times since 2024), and Grafana's open-source white-labeling is, by the project's own community's admission, a hack that requires vigilance during upgrades. The entire Grafana WordPress dashboard approach assumes you have someone on staff, or at least on retainer, who can debug a broken cron job or a changed API endpoint without escalating to a full project.
There's also an honesty question about what these dashboards actually prove. A Grafana panel showing 14,000 Instagram impressions next to a WordPress panel showing 340 sessions from social referrals tells a story, but the causal link between those two numbers is attribution modeling, and attribution modeling in 2026 is still as much art as science. The dashboard will show correlation beautifully. Whether it proves that your social campaign drove those WordPress conversions, or whether those users would have arrived anyway, is a question the technology alone cannot answer. Agencies that present these dashboards as proof of ROI rather than evidence of activity are building a credibility debt that compounds with every reporting cycle. The honest move is framing the dashboard as visibility into what happened, not a closed-loop proof of what worked, and letting the trend data over 3 to 6 months build the causal argument that a single monthly snapshot never can.