
OpenObserve, an open-source observability platform, advertises 140x lower storage costs than Elasticsearch for log, metric, and trace ingestion. That ratio matters when you manage 20, 40, or 80 white-label WooCommerce stores, each generating PHP warnings, slow-query logs, payment gateway timeouts, and cron failures that pile up unread until a client reports lost orders. The storage cost of observability has historically been the reason agencies skip it entirely. But the cost of skipping it compounds faster than any hosting bill.
This article breaks down what production debugging WordPress looks like when you're running white-label e-commerce at scale, where the bugs actually live, and why the WordPress ecosystem's default tools leave critical gaps in your ability to diagnose problems on live stores.
Why WooCommerce Stores Break Differently Than Brochure Sites
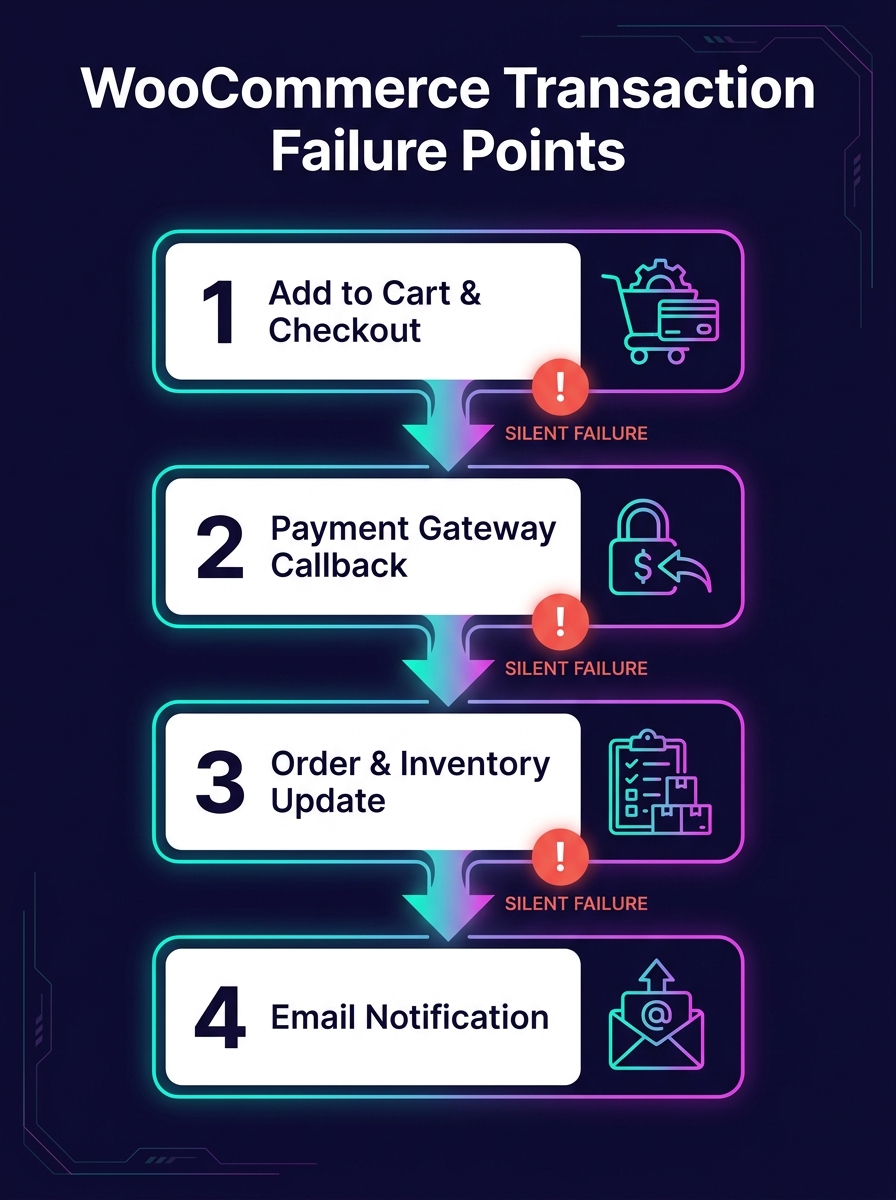
A marketing site with five pages and a contact form generates a narrow range of errors. A WooCommerce store with variable products, conditional shipping rules, payment gateways, tax calculations, and third-party fulfillment integrations generates an order of magnitude more failure modes. And the failures carry direct revenue consequences: a fatal error on a checkout page costs money in real time.
The debugging challenge multiplies in white-label arrangements. Your team built the store, but the end client's marketing agency might install plugins you've never tested. Their hosting environment might differ from your staging setup. Their traffic patterns might trigger race conditions that never appear in development.
When you're debugging production WordPress issues your team can't replicate locally, the variables multiply further. WooCommerce adds payment webhook timing, inventory sync conflicts, session handling under load, and cart fragment AJAX calls that behave differently on cached vs. uncached pages.
WordPress's Built-In Debug Tools Were Designed for Development
The WordPress Advanced Administration Handbook documents a debugging system built around four constants: WP_DEBUG, WP_DEBUG_LOG, WP_DEBUG_DISPLAY, and SCRIPT_DEBUG. Setting WP_DEBUG to true in wp-config.php activates PHP error reporting. WP_DEBUG_LOG writes those errors to a debug.log file in wp-content. WP_DEBUG_DISPLAY controls whether errors render on screen.
This system works on a local machine while you're building a theme. It falls apart on a production WooCommerce store for three reasons.
First, the debug.log file grows without rotation. On a busy store processing hundreds of orders daily, that file can balloon to gigabytes within weeks. Nobody monitors its size. Nobody reads its contents until something breaks badly enough to investigate.
Second, there's no structured format. Every entry is a flat text string with a timestamp. You can't filter by severity, by plugin origin, by request URL, or by user session. Grep is your only tool, and grep against an unstructured 2GB log file on a production server is a miserable experience.
Third, there's no alerting. The log file sits on disk, silently accumulating. BugSnag's WordPress plugin changes this by automatically detecting errors and crashes on your site and routing notifications to email, Slack, or issue trackers. But most white-label agencies don't install error monitoring on client stores because the per-site setup cost feels prohibitive when you're managing dozens of them.
Building an Agency Log Management Stack That Scales
The gap between WordPress's debug.log and a proper observability white-label development setup is where agencies lose the most time and the most money. Bridging that gap doesn't require a six-figure infrastructure investment. It requires a deliberate stack choice and consistent deployment across all client stores.
Structured Logging at the Source
WP Debug Toolkit, as reviewed by Oxygen and Breakdance, writes query logs to JSON files on disk rather than the WordPress database. This design matters for WooCommerce stores because it avoids adding write load to a database that's already handling order transactions. JSON-structured logs can be parsed programmatically, filtered by plugin, and shipped to a centralized platform.
The pattern you want: every white-label store writes structured logs locally, and an agent (Fluentd, Filebeat, or Grafana Alloy) ships those logs to a central system. Each log entry should include the site identifier, the request URI, the PHP error level, and a timestamp in ISO 8601 format.
Centralized Ingestion and Search
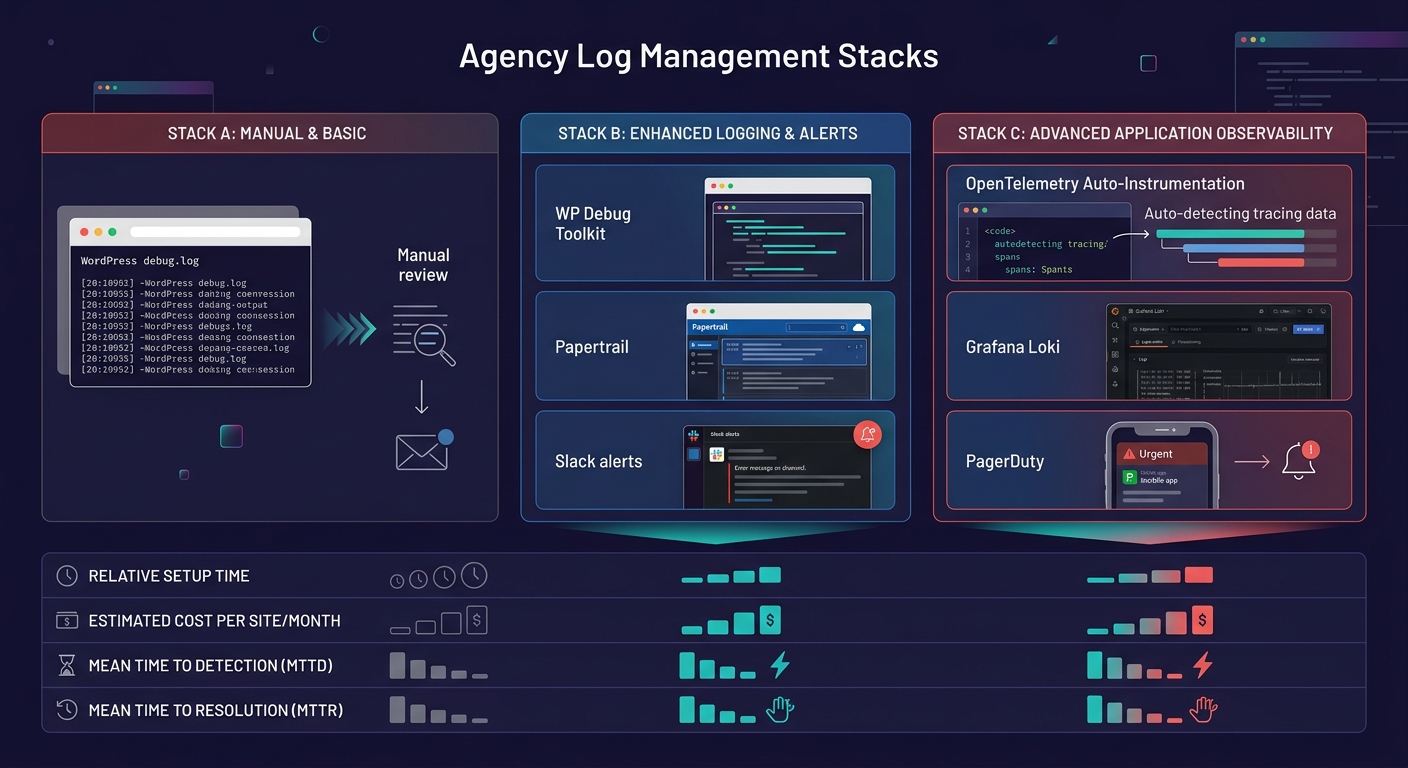
For agency log management at scale, you need a central platform where logs from all client stores converge. OpenObserve, Grafana Loki, and Papertrail all serve this function at different price points. The choice depends on your volume and your team's comfort with self-hosted vs. managed infrastructure.
Papertrail handles database logs, PHP debug logs, and slow query logs from WordPress installations and lets you set alerts based on patterns. If a WooCommerce payment gateway starts throwing 500-level errors at 2 AM, your on-call developer gets a Slack notification before the client's customers start tweeting about it.
White-Label Dashboards as a Revenue Layer
Logtivity offers a white-label mode for agencies that lets you rebrand the activity logging interface. DoHost's research on log aggregation for resellers frames error monitoring as a premium add-on, suggesting agencies can offer white-labeled logging dashboards as a paid service tier for clients who want visibility into their store's health.
This reframes WordPress runtime monitoring from a cost center into a revenue stream. If you're already running the infrastructure, charging clients $50–150/month for access to a branded uptime and error dashboard is straightforward. When you're calculating your white-label margins, the monitoring tier adds recurring revenue with near-zero marginal cost per additional site.
The gap between WordPress's debug.log and real observability is where agencies lose the most time and the most money.
Staging-Production Parity and the E-Commerce Data Gap
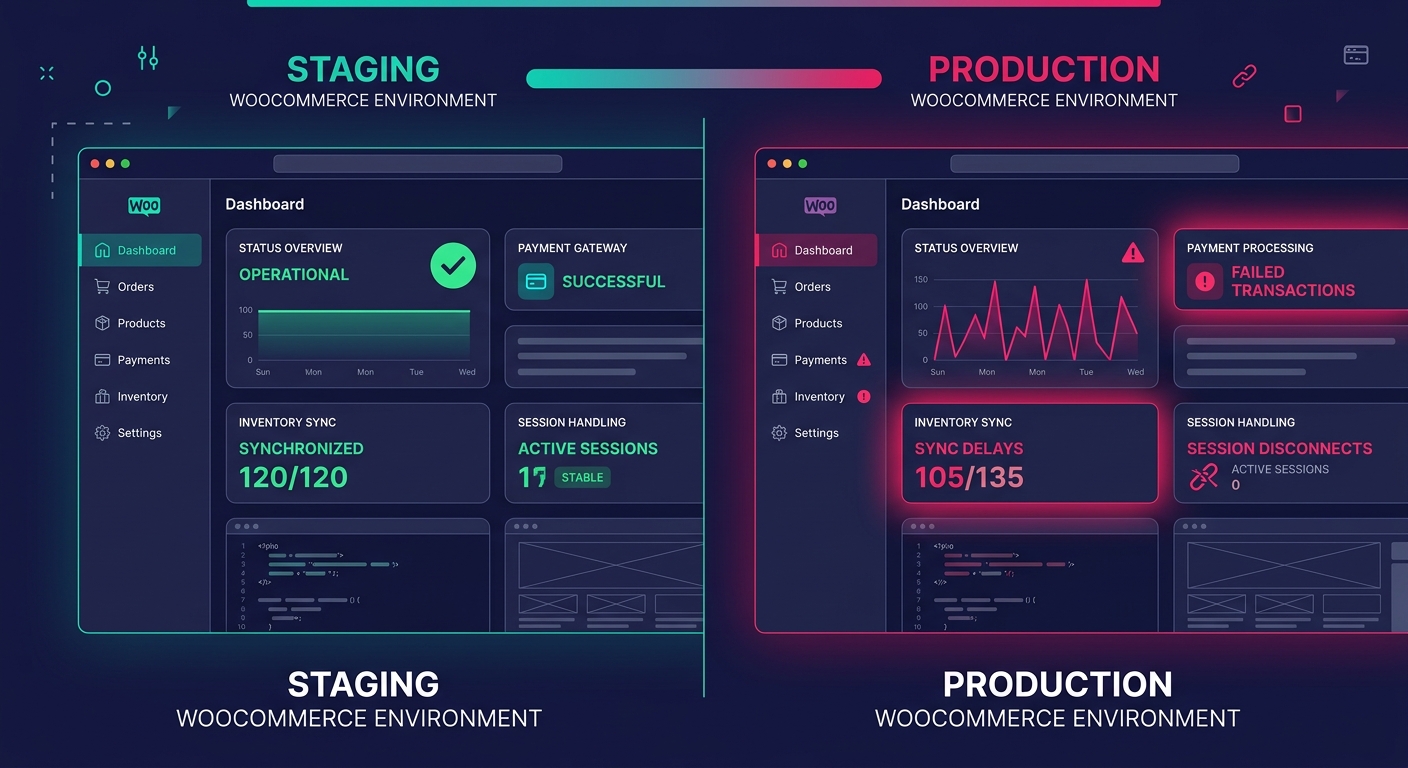
Production debugging for WordPress agencies gets harder when your staging environment lies to you. We've written about why staging-production parity breaks down in detail, but e-commerce stores amplify every gap.
Staging environments rarely replicate real payment gateway sandbox behavior accurately. They don't carry the same volume of product data, order history, or customer sessions. Caching layers differ. CDN configurations differ. And WooCommerce's behavior under concurrent checkout sessions, where two customers try to buy the last item in stock at the same time, can't be tested meaningfully in staging.
This is precisely why production observability matters more for e-commerce than for any other WordPress vertical. You can't test your way out of production-only failures. You have to detect them with real traffic data, diagnose them with structured evidence, and fix them with confidence that your change addresses the actual root cause.
OpenTelemetry's auto-instrumentation for PHP, which has matured significantly, can capture request traces, database call durations, and external HTTP request latencies from a live WooCommerce store without modifying application code. The trace data shows you that a checkout request took 11 seconds because the shipping rate API timed out, which cascaded into a session lock that blocked three other customers. That's the kind of insight a debug.log file will never surface.
Where Auto-Instrumentation Hits Its Ceiling
The phrase "observability without instrumentation" is aspirational, not literal. OpenTelemetry's PHP auto-instrumentation captures generic request and database telemetry, but it doesn't understand WooCommerce's domain-specific events. It won't tell you that an order status transition from "pending" to "processing" failed because a webhook payload from Stripe was malformed. That level of insight requires custom log statements at specific points in the WooCommerce lifecycle: order creation, payment confirmation, inventory adjustment, email dispatch.
For white-label teams managing dozens of stores, the practical approach is layered. Auto-instrumentation handles the infrastructure layer (PHP execution, MySQL queries, HTTP calls). A lightweight mu-plugin deployed across all sites handles the application layer (WooCommerce hooks for order events, cart mutations, and gateway responses). And centralized log aggregation ties both layers together with a shared site identifier.
The mu-plugin approach works well because mu-plugins load before regular plugins and can't be deactivated from the admin dashboard. When a client's marketing team installs a coupon plugin that conflicts with your checkout flow, your mu-plugin's logging captures the failure regardless of what caused it. We've written about building self-healing client infrastructure before, and the monitoring mu-plugin fits that same philosophy: agency-controlled code that protects the environment from client-side changes you can't predict.
Tip: Deploy your monitoring mu-plugin via Git or your deployment pipeline, not through the WordPress admin. This ensures consistent versions across all white-label stores and prevents clients from accidentally removing it.
What the Numbers Can't Measure Yet
The 140x storage cost reduction that OpenObserve advertises tells you something about the economics of log ingestion. It tells you nothing about whether your team will actually look at the dashboards. The most sophisticated observability stack in the world produces zero value if nobody configures meaningful alerts or reviews anomaly reports during weekly ops meetings.
Similarly, the tools for WordPress runtime monitoring have improved dramatically. BugSnag catches crashes. Papertrail aggregates logs. OpenTelemetry traces requests across services. But none of these tools can tell you whether the bug you're seeing on a client's WooCommerce store is a code defect, a hosting misconfiguration, a plugin conflict introduced by the client, or a data integrity issue caused by a failed migration. That judgment still requires a developer who understands WooCommerce internals, reads structured logs fluently, and can correlate timing data across multiple systems.
The data gives you speed and evidence. It narrows the search space from "something is wrong with the store" to "this specific function in this specific plugin threw this specific error during this specific request at this specific time." That narrowing is the entire value proposition of production debugging WordPress at scale. Whether your team can close the remaining distance, from evidence to fix to prevention, still depends on the people reading the data, not the tools collecting it.