

A developer published a diagnostic framework for WordPress performance troubleshooting on DEV Community September 6, presenting a measurement-first approach to identifying server-side and browser-side bottlenecks, according to the post by Toyaab. The framework maps WordPress request paths from DNS through database queries to browser rendering, distinguishing between delays that occur before HTML delivery and those that happen during front-end execution.
TL;DR: A developer published a systematic diagnostic framework September 6 for identifying WordPress performance bottlenecks, emphasizing measurement before optimization and distinguishing server-time delays from browser-time problems.
The framework addresses what the developer characterizes as a common optimization mistake: applying multiple performance fixes before measuring the original problem. "Installing a caching plugin may improve one website dramatically while making little difference to another," the post states, noting that random changes prevent agencies from understanding which intervention solved which bottleneck. The proposed workflow follows a seven-step sequence: Observe, Measure, Form a Hypothesis, Test, Identify Bottleneck, Optimize, Measure Again.
Server Time Versus Browser Time Distinction
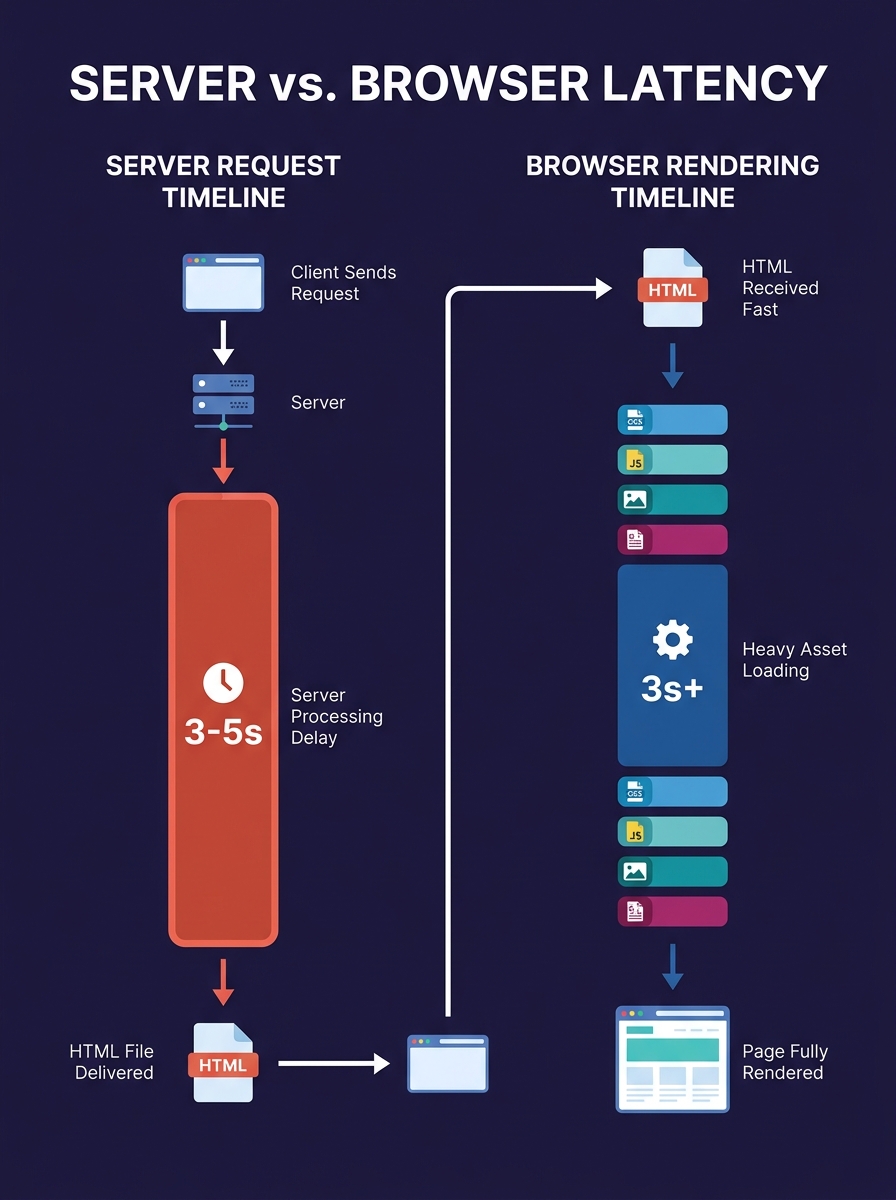
The framework emphasizes identifying whether delays occur during server response generation or during browser rendering, according to the post. A slow server response—measured in seconds before the browser receives HTML—may involve hosting infrastructure, PHP execution speed, database queries, plugin overhead, theme code, external API requests, or server resource constraints. A fast server response followed by slow rendering typically indicates large JavaScript bundles, excessive CSS, unoptimized images, web fonts, or third-party script overhead.
The distinction guides optimization strategy, the developer writes. Server-side delays require database query optimization, plugin auditing, hosting upgrades, or caching implementation. Browser-side delays demand JavaScript reduction, image compression, resource prioritization, or third-party script management. Agencies managing white-label WordPress development projects need both diagnostic paths because client sites exhibit both categories of performance problems.
Measurement-First Diagnostic Approach
The framework rejects optimization-before-diagnosis workflows, the post states. The developer outlines a scenario where someone installs a caching plugin, enables image compression, minifies CSS, combines JavaScript, changes hosting, and installs another optimization plugin in rapid succession. "The website may become faster," the post notes, "but nobody knows which change solved the problem, whether another change introduced a new problem, or whether the original bottleneck still exists."
The alternative workflow requires baseline measurement, hypothesis formation, single-variable testing, and post-optimization measurement. This iterative approach prevents agencies from deploying ineffective fixes, according to the framework. Performance work should produce measurable outcomes tied to specific interventions rather than stacked guesses, the developer writes.
Core Web Vitals as User-Experience Indicators
The framework incorporates three Core Web Vitals metrics as user-experience indicators beyond speed scores, according to the post. Largest Contentful Paint measures how quickly main content becomes visible and can be affected by slow server response, render-blocking resources, large images, slow fonts, client-side rendering, or poor resource prioritization. Interaction to Next Paint measures responsiveness to user interactions and can be degraded by excessive JavaScript, long-running tasks, heavy third-party scripts, inefficient event handlers, or large client-side applications.
Cumulative Layout Shift measures unexpected content movement during page load, often caused by images without reserved dimensions, dynamically injected content, ads, web fonts, or late-loading components, the post states. A page can load quickly while providing poor user experience if content constantly shifts or interactions feel unresponsive, the developer notes. Agencies delivering client sites need to address all three metrics rather than optimizing for single-number speed scores.
WordPress sites face distinct performance optimization challenges when plugins, theme code, and database queries compound across the request lifecycle. The framework's request-path visualization maps every delay point from DNS resolution through database queries to browser rendering, according to the post. Understanding where time is spent allows agencies to target optimization work effectively rather than applying generic fixes.
What Happens Next
Digital agencies managing ongoing WordPress development should evaluate whether their performance diagnosis workflows systematically identify bottlenecks before applying fixes. The measurement-first approach reduces wasted optimization work when agencies can attribute performance gains to specific interventions. Teams handling multiple client sites need diagnostic procedures that scale across different hosting environments, plugin combinations, and theme architectures.
The framework's emphasis on distinguishing server-time from browser-time delays guides agencies toward appropriate optimization strategies. Server-side problems require PHP profiling, database query analysis, and plugin overhead measurement—diagnostic work that happens before HTML delivery. Browser-side problems require asset auditing, JavaScript profiling, and third-party script management—optimization work that addresses what happens after the browser receives the page. Agencies that systematically diagnose both categories deliver faster client sites with measurable performance improvements rather than stacked generic fixes that may or may not address underlying bottlenecks.