
Automated performance regression detection runs synthetic audits against every deployment in a CI/CD pipeline, compares Core Web Vitals scores to stored baselines, and flags commits that push metrics past defined thresholds. The common assumption that post-launch monitoring catches these slowdowns fails because manual scans detect problems after clients already feel them.
TL;DR: Performance regression detection works by establishing per-site baselines, running automated Lighthouse audits on every code change, comparing deltas across a multi-client portfolio, and surfacing regressions as branded client reports. Agencies that implement this mechanism report a 42% increase in monthly recurring revenue within six months and a 60% reduction in emergency support calls.
The Baseline Layer: Establishing What "Normal" Looks Like Per Client
Every regression detection system starts with a performance baseline: a stored snapshot of Core Web Vitals (LCP, CLS, INP) and server-side metrics (TTFB, database query count, PHP execution time) captured under controlled conditions. Without this baseline, you're comparing against nothing, and every number is meaningless.
The WordPress core team recognized this problem at the platform level. As documented in their automated performance monitoring initiative, "adding automated performance testing will help us monitor performance changes in WordPress core continuously." Their approach captures per-commit deltas against a fixed reference. The same principle scales to white-label agencies managing 50+ client sites.
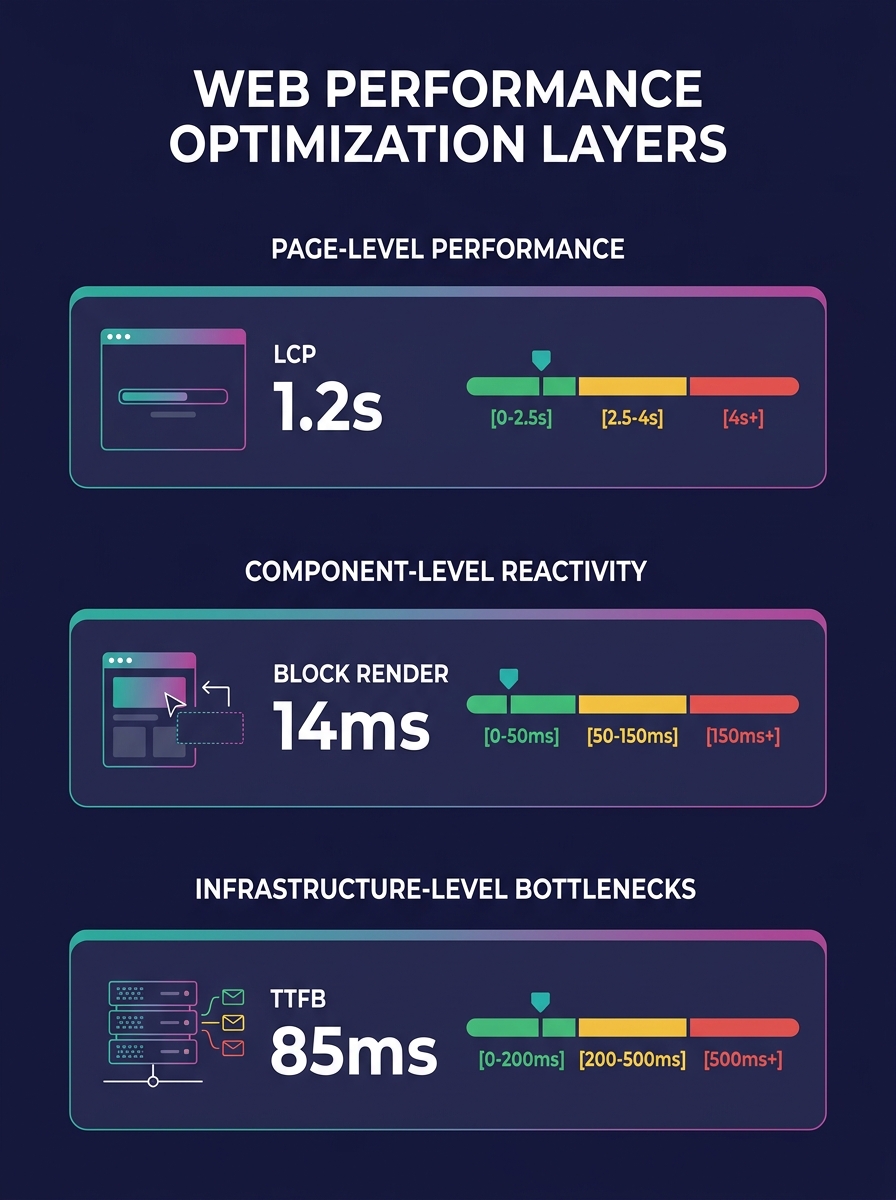
For a white-label WordPress performance testing setup, you need baselines at three levels:
- Page-level baselines: homepage, top 5 landing pages, WooCommerce product/cart/checkout pages
- Component-level baselines: individual block render times, plugin load costs, theme asset weights
- Infrastructure-level baselines: TTFB from your primary hosting region, MySQL query count per page type, object cache hit rates
You store these as JSON artifacts in your CI system. Every future test run compares against these numbers. A 15% LCP increase on a WooCommerce checkout page is a regression. A 3% fluctuation on a blog archive is noise. The thresholds vary by page type and client SLA, and getting these right is what separates useful alerts from alert fatigue.
The Trigger Mechanism: Per-Commit Audits in CI/CD
The detection system fires on every deployment, not on a schedule. This distinction matters. Scheduled monitoring (running GTmetrix once a week, for instance) tells you something broke. Per-commit testing tells you which commit broke it.
Lighthouse CI is the most common tool for this in WordPress workflows. As PB4Host's performance testing documentation describes, "Lighthouse CI integrates Lighthouse testing into CI/CD pipelines for automated performance regression detection." The integration spins up a temporary environment, runs a full Lighthouse audit, and compares results against stored baselines before the deployment reaches staging or production.
Here's how the trigger flow works for a typical white-label agency using GitHub Actions or GitLab CI:
- A developer pushes a commit (plugin update, theme change, new block)
- The CI pipeline deploys to a temporary environment with production-mirrored data
- Lighthouse CI runs audits against the predefined page list
- Results are compared to the stored baselines
- If any metric exceeds the threshold delta, the pipeline either blocks deployment or flags a warning
- The delta report is logged as a CI artifact
That step 2 is where most agencies fail. The temporary environment needs production-like data, production-like server resources, and production-like caching configurations. If your test environment runs on a $5/month VPS while your client sites live on Cloudways or Kinsta, your numbers are fiction. We've written about this exact problem in the context of maintaining debug parity between staging and production, and the patterns there apply directly to performance baselines.
The Comparison Engine: Delta Detection Across a Portfolio
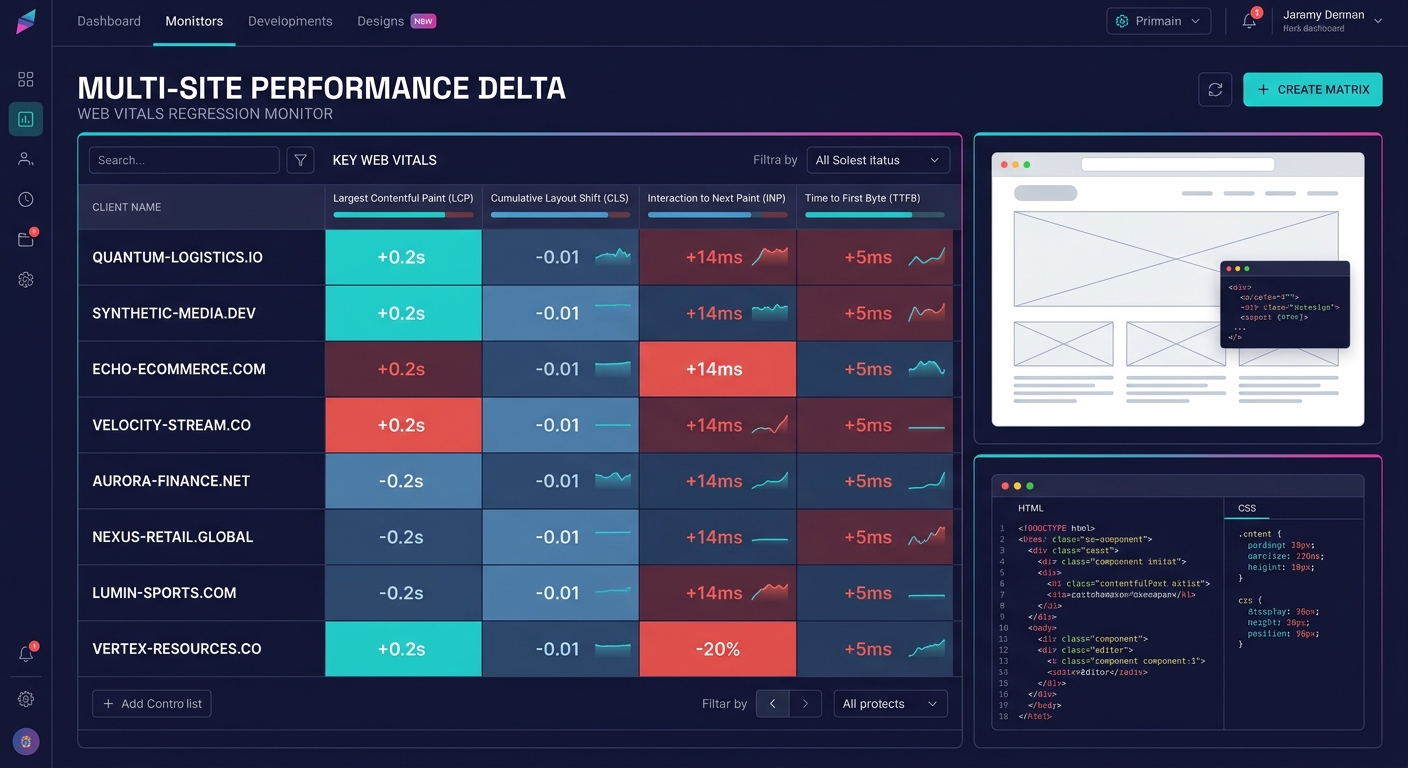
Single-site regression detection is straightforward. Multi-client performance benchmarking across 30, 50, or 100+ white-label sites is where the mechanism gets interesting and where the content marketing value surfaces.
When you push a shared component (a plugin update, a core theme framework change), that update hits every site in your portfolio. The comparison engine runs parallel audits across all affected sites and produces a delta matrix: which sites improved, which degraded, and by how much.
Agencies running shared component libraries across their portfolios get a real operational advantage here. A centralized component means centralized testing. One audit run covers 100 sites. But it also means one bad commit can degrade 100 sites simultaneously, and the delta matrix is the only thing standing between you and 100 angry client emails.
The delta matrix typically tracks these columns per site:
| Metric | Baseline | Current | Delta | Status |
|---|---|---|---|---|
| LCP (mobile) | 2.1s | 2.4s | +14.3% | ⚠️ Warning |
| CLS | 0.04 | 0.04 | 0% | ✅ Pass |
| INP | 180ms | 210ms | +16.7% | ❌ Fail |
| TTFB | 340ms | 355ms | +4.4% | ✅ Pass |
| DB Queries | 42 | 58 | +38.1% | ❌ Fail |
A 38.1% increase in database queries is the kind of silent regression that no client will notice for weeks, not until their traffic spikes and the MySQL server buckles. Catching it here, before deployment, is the entire point of automated regression detection.
Staging Environment Performance Parity: The Hardest Technical Problem
Why do staging benchmarks diverge from production reality? Three reasons, all of them mundane and all of them devastating to your performance KPI automation.
First, resource allocation. Staging environments almost never match production server specs. If your client's production site runs on 4 vCPUs and 8GB RAM behind a Varnish cache, your staging box needs to mirror that. Full system-level benchmark runs require production-like workload models. Anything less produces optimistic numbers that collapse under real traffic.
Second, data volume. A staging site with 50 test products behaves differently from a WooCommerce store with 12,000 SKUs. Database query times scale with table size, and index performance depends on row count. Your automated tests need to run against realistic data volumes, which means maintaining anonymized database snapshots from production as part of your staging pipeline.
Third, caching state. Production sites benefit from warm object caches, CDN edge caches, and browser caches that staging environments typically lack. A cold-cache Lighthouse audit on staging will always show worse TTFB than the same page on production with a warm Varnish layer. You need to account for this by warming caches before audits or by establishing separate cold-cache baselines.
We've covered the broader operational challenges of environment parity at scale before. Staging has to perform like production under load conditions that approximate real traffic patterns. Visual parity alone won't surface server-side bottlenecks.
Warning: A staging environment that returns 200ms TTFB while production returns 600ms under load will mask every server-side regression your CI pipeline tests for. Match your staging server specs to production before trusting any automated benchmark.
The Reporting Layer: Turning Regressions into Client-Facing Content
Here's where automated regression detection crosses from an engineering concern into a content marketing tool. Every blocked regression, every caught slowdown, every performance delta becomes a data point in your client reports.
Agencies bundling automated care plans that include performance monitoring layers report a 42% increase in monthly recurring revenue within 6 months and a 60% reduction in emergency support calls. Those numbers come from the operational reality that catching problems before clients notice them transforms your agency relationship from reactive firefighting to proactive guardianship.
Tools like WP Managify let you generate white-labeled performance reports with your agency's branding: logo, colors, custom headers. But the raw report isn't the valuable content. The valuable content is the narrative: "This month, our automated systems caught and blocked 3 performance regressions before they affected your site. Here's what would have happened if they'd shipped."
Every blocked regression becomes a data point in your client reports, making invisible work visible and quantifying what "managed maintenance" actually means in dollar terms.
That narrative, delivered monthly in a branded report, is the strongest retention mechanism available to white-label agencies. It makes invisible work visible. It quantifies what "managed WordPress hosting and maintenance" actually means. And it gives clients a concrete reason to keep paying for post-launch support contracts, turning an operational cost center into a recurring revenue argument.
Performance KPI automation feeds this reporting layer automatically. You define the KPIs (LCP under 2.5s, INP under 200ms, TTFB under 800ms), the system tracks them per site per deployment, and the reporting tool pulls the latest numbers into a branded PDF or dashboard. No manual data collection. No copying numbers from GTmetrix into a spreadsheet.
Where the Model Breaks
This mechanism has real failure modes that agencies should understand before investing in it.
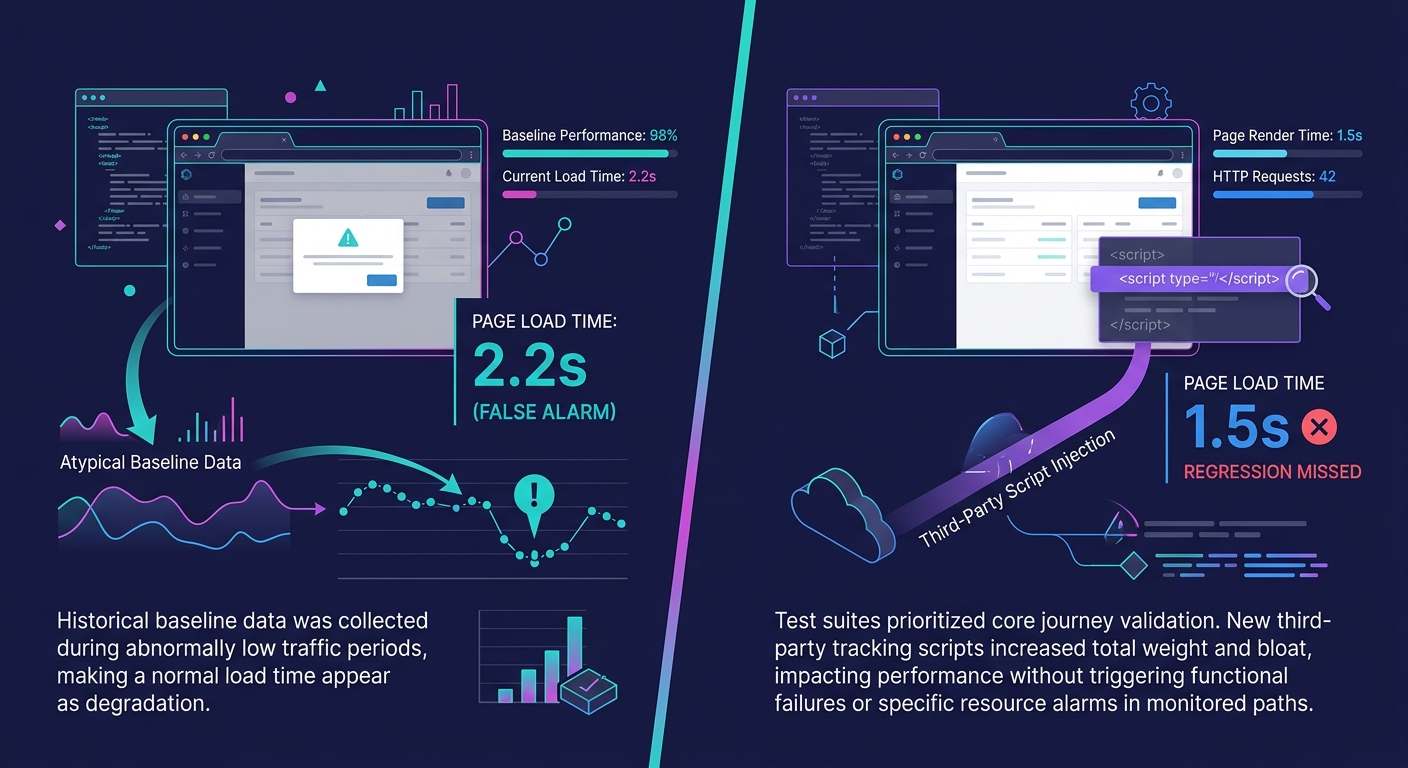
The biggest weakness is false confidence from unrepresentative baselines. If your baseline was captured on a day when your staging server had unusually low load, every subsequent test will compare against an optimistic number. You'll flag regressions that don't exist in production and miss regressions that do. Baselines need periodic recalibration: quarterly at minimum, or after any infrastructure change.
Second, Lighthouse scores are synthetic. They measure performance under controlled conditions with simulated throttling, not under the actual network conditions your client's visitors experience. A site that passes every Lighthouse audit can still feel slow on a 3G connection in rural Australia. Real User Monitoring (RUM) data from tools like Google's CrUX report fills this gap, but most white-label CI pipelines don't incorporate RUM into their gating logic.
Third, the mechanism scales linearly with portfolio size. Running Lighthouse audits against 100 sites on every commit takes compute resources and CI minutes. At scale, agencies need selective testing: audit only the sites affected by a given commit, not the entire portfolio. This requires dependency mapping between shared components and individual client sites, which adds significant operational complexity.
And fourth, performance regression detection catches slowdowns in code and configuration. It doesn't catch slowdowns caused by external factors: a client's hosting provider throttling resources, a CDN outage, or a third-party analytics script adding 500ms of render-blocking JavaScript. Your CI pipeline will show green on every deploy while the live site crawls because of something entirely outside your codebase. Monitoring production with RUM alongside synthetic CI testing is the only way to cover both failure modes.
The mechanism works despite these gaps because it catches the highest-volume regression source (internal code changes) at the point where fixing them is cheapest. A regression caught in CI costs a developer 15 minutes of investigation. The same regression caught by a client three weeks later costs hours of apologetic email threads, emergency debugging, and trust repair that no branded report can recover.