
Three white-label WordPress partners can look identical across LinkedIn profiles and portfolio pages: similar project counts, matching rates, comparable turnaround promises. The differences surface 60 days into production, when code quality, communication patterns, and security habits diverge. A quality scorecard framework built on vendor performance metrics prevents that 60-day surprise.
TL;DR: Agencies vet white-label WordPress partners using three scorecard models: retrospective reviews, real-time KPI dashboards, and social/community signal layers. Each has different setup costs, data freshness, and bias risks. Combining at least two gives you reliable outsourced team evaluation without slowing partner onboarding to a crawl.
Retrospective Scorecards: The Spreadsheet You Already Have
After a project wraps, someone on your team rates the partner on delivery speed, code quality, and communication. The data lands in a Google Sheet or a Slack thread that nobody checks again. This is the retrospective scorecard, and most agencies already run some version of it.
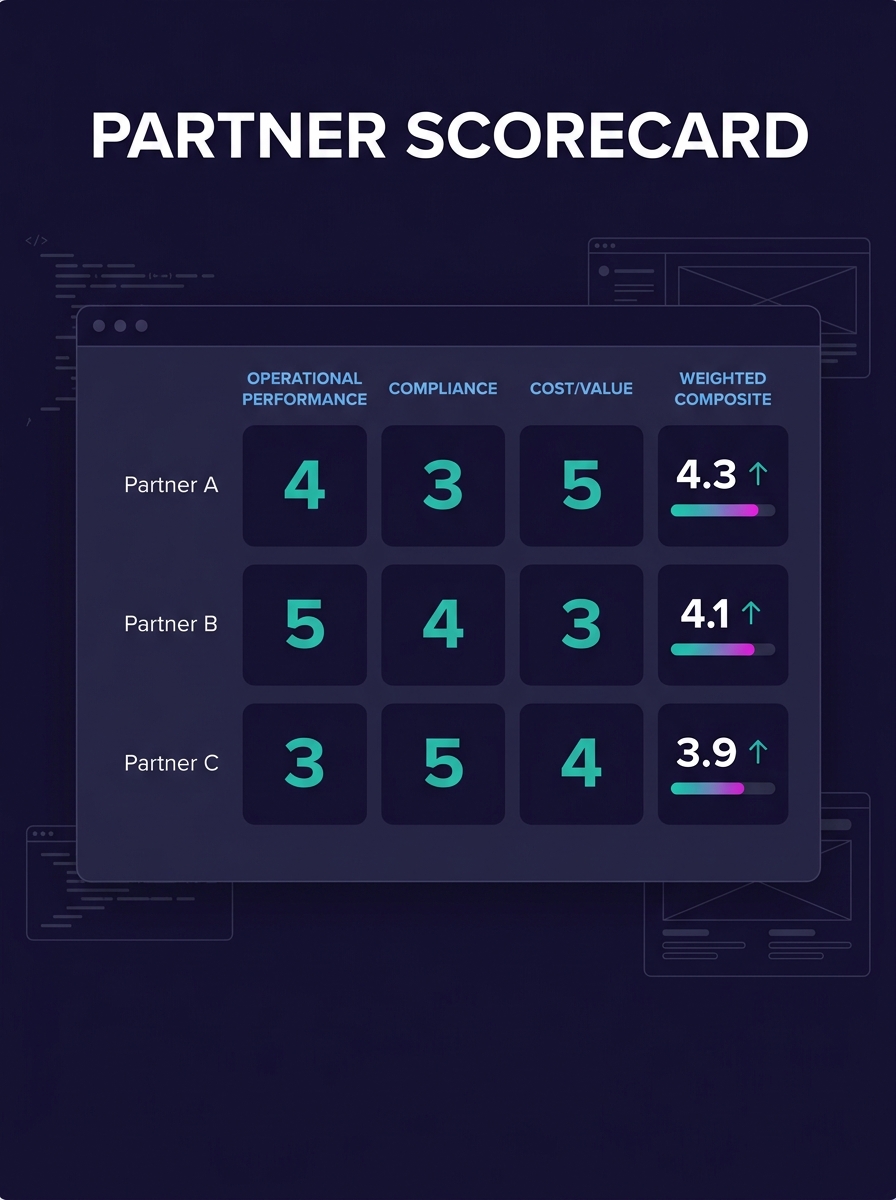
The structure holds up for a reason. Amazon's vendor scorecard guide identifies 3 key dimensions every scorecard should cover: operational performance, compliance, and cost/value. A basic spreadsheet can track all three. You score each completed project on a 1-to-5 scale across those dimensions, weight them by priority, and calculate a composite number. Setup takes 1 to 2 hours.
The problem is timing. Retrospective scorecards update after project delivery, creating a 30-to-90-day lag between a partner's work and your evaluation. If a white-label team's quality dropped in week 2, you won't see it in the data until week 12. By then, you've assigned them 4 more client sites.
Ramp's supplier scorecard template tracks 3 critical metrics for this model: product quality, return frequency, and order completeness. Translated to white-label WordPress work, those become: percentage of deliverables passing QA on first submission, number of revision rounds per project, and percentage of scope items delivered by deadline. Wowww Agency's partnership guide reinforces this baseline: "Vet candidates thoroughly. Look at their track record, experience in your niche, and client reviews."
For agencies running fewer than 5 white-label projects per month, this model works. Beyond that volume, the data lag becomes dangerous.
Where Social Signals Fill the Gap
When you're building a retrospective scorecard for a partner you haven't worked with yet, social channels provide the initial data. LinkedIn recommendations from other agencies, WordPress.org plugin contribution history, and GitHub commit patterns give you a quality proxy before the first project ships. But social proof measures reputation, not current performance. A partner with 500 LinkedIn followers and glowing testimonials may have lost their senior developer 6 months ago.
Real-Time KPI Dashboards: Automated Vendor Performance Metrics
Real-time dashboards pull data from your project management tools, Git repositories, and uptime monitors to score partners continuously. Instead of waiting for a project to close, you see quality signals as work happens. This is where white-label partner vetting shifts from backward-looking to preventive.
Ivalua's vendor scorecard guide defines 6 KPIs that best-in-class programs track: quality, delivery timeliness, cost competitiveness, risk mitigation, ESG compliance, and innovation. For white-label WordPress, the practical translation looks like this: code review pass rate, sprint delivery accuracy (percentage of tasks completed within the agreed sprint window), hourly rate trends over 6+ months, security vulnerability count per project, WordPress coding standards compliance rate, and proactive improvement suggestions per quarter.
Automation makes a measurable difference. According to procurement platform data, automated scorecard systems reduce data entry errors by up to 90% and keep scores current without manual updates. For agencies managing 10 or more white-label projects each month, that accuracy matters. Manual tracking at that volume introduces the kind of inconsistencies that make the entire scorecard unreliable.
Richard Banfield, a product leadership author, warns about a critical trap in real-time dashboards: "Measuring velocity is a trap. It encourages teams to measure the outputs of their work." Tracking commits per day or tickets closed per sprint feels productive but rewards speed over substance. Your dashboard should weight outcome metrics (client satisfaction scores, post-launch bug count, Core Web Vitals results) at 60% minimum and activity metrics (tickets closed, hours logged) at no more than 40%.
If your current vetting process can't produce a confidence score on a new partner within 48 hours, you're losing good partners to agencies that move faster.
The setup cost is real. You need integrations between your project management tool (Asana, ClickUp, Monday, or Jira), your code repository (GitHub or Bitbucket), and a reporting layer. Most agencies spend 2 to 4 weeks configuring this pipeline. If you've already tackled measuring technical debt across your white-label portfolio, you likely have the code-quality data flowing. The dashboard just surfaces it in a different view.
Connecting Dashboards to White-Label Risk Management
A real-time dashboard turns white-label risk management from reactive to preventive. When a partner's code review pass rate drops below 70% over 2 consecutive sprints, you flag the relationship before a client site suffers. Pair this with the patterns described in how white-label teams skip testing at scale, and you can spot compounding problems weeks before they reach production.
Warning: The biggest risk with dashboards is over-measurement. Tracking 25 KPIs creates noise. Start with 5 core metrics, run for 90 days, then add metrics only when a specific quality incident reveals a gap you weren't tracking.
Social Signal Scoring: Community Reputation as a Formal Vetting Layer
The third model treats social media and community presence as structured inputs to your quality scorecard framework. This is where outsourced team evaluation intersects with the platforms your team already uses daily: LinkedIn, Twitter/X, WordPress.org, GitHub, and agency-focused Slack and Discord communities.
David Ribott of Ribott Partners captures the principle well: "Ownership is the trust engine." Partners who participate in public communities, answer questions on WordPress forums, contribute to open-source plugins, and share technical thinking on social channels demonstrate craft ownership in a way that's hard to fake at volume.
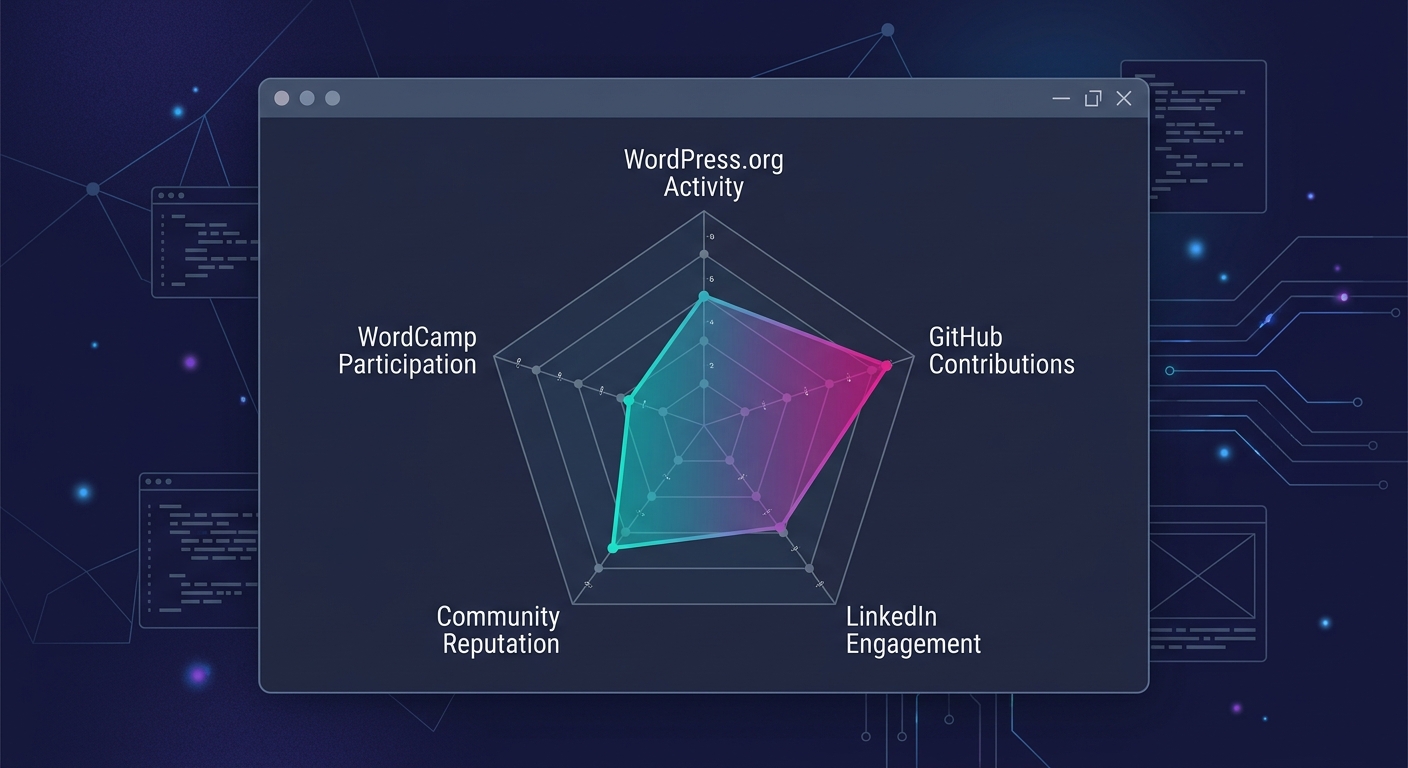
Here's what to formalize into a scoring rubric with weighted categories:
- WordPress.org profile activity: Plugin or theme contributions, support forum responses, and core contribution credits. A partner with 50 or more resolved support forum threads shows debugging discipline. Weight this at 25% of the social signal score.
- GitHub contribution history: Commit frequency, code review participation, and repository documentation quality. Look for consistent activity over 12+ months, not short bursts. Weight at 30%.
- LinkedIn engagement quality: Technical posts about WordPress architecture, anonymized client case studies, and peer endorsements from other agency owners. A partner posting weekly about Gutenberg block development or WooCommerce performance signals current expertise. Weight at 20%.
- Community reputation in agency channels: References from other agencies in shared Slack groups, WordCamp speaking history, and WordPress meetup participation. Weight at 25%.
This model excels where the other two can't: evaluating partners you haven't worked with yet. Before you assign a single project, social signals give you a quality baseline. For agencies still building their initial partner vetting framework, social scoring fills the data vacuum that retrospective and dashboard models need months of project history to close.
The weakness is equally clear. Social presence correlates with quality but doesn't guarantee it. A developer with 10,000 LinkedIn followers and a polished portfolio might still deliver sloppy, insecure code. Social signal scoring should never exceed 30% of your total scorecard weight. Use it for initial screening and ongoing reputation monitoring, not as the primary evaluation method.
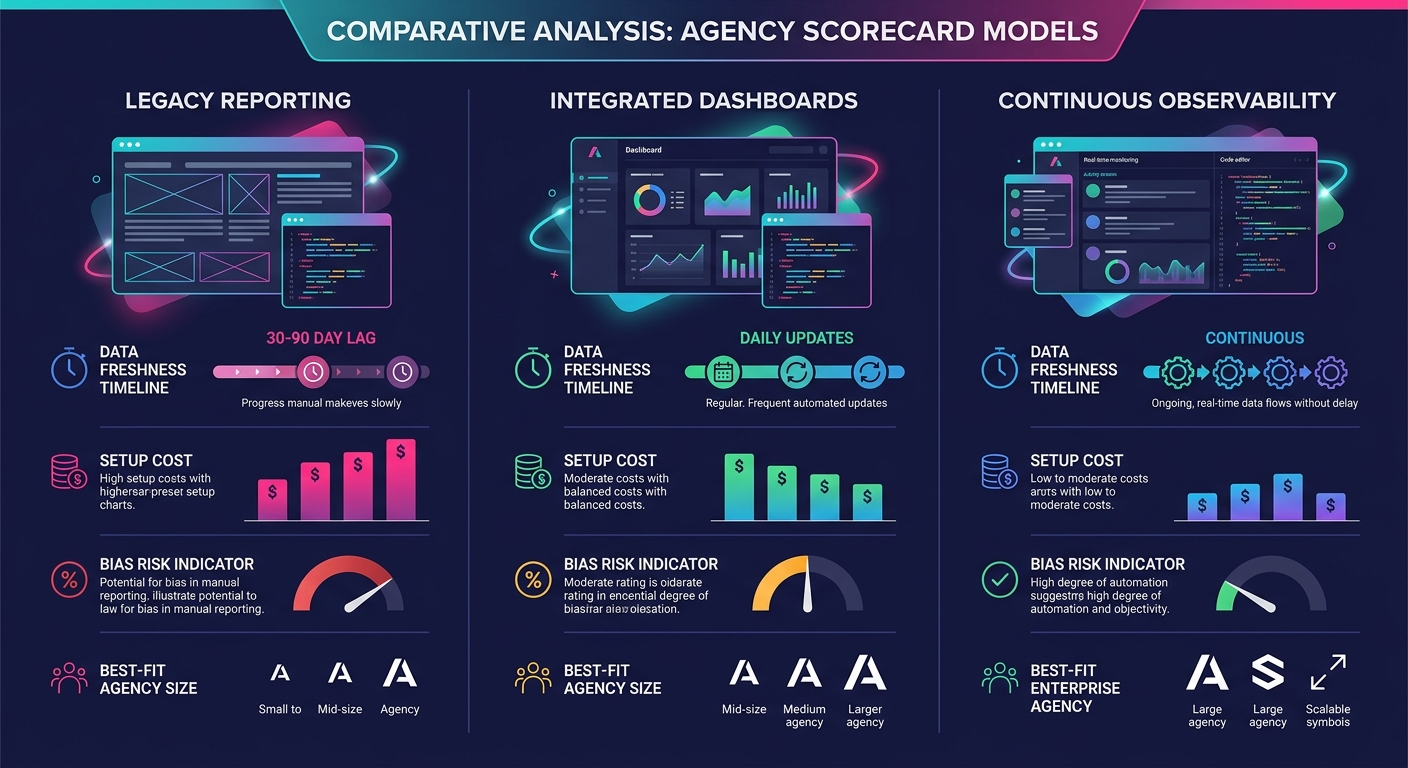
Side-by-Side Comparison
| Attribute | Retrospective Scorecard | Real-Time KPI Dashboard | Social Signal Layer |
|---|---|---|---|
| Data freshness | Post-project (30-90 day lag) | Daily or weekly auto-updates | Continuous public data |
| Setup time | 1-2 hours (spreadsheet) | 2-4 weeks (tool integrations) | 3-5 hours (rubric + initial audit) |
| Ongoing effort | 15-30 min per completed project | Minimal after configuration | 1-2 hours per month per partner |
| Bias risk | High (recency bias, halo effect) | Low (automated data collection) | Medium (popularity ≠ quality) |
| Best for | Agencies with fewer than 5 projects/month | Agencies with 10+ projects/month | New partner evaluation |
| Monthly cost | Free | $50-200 in tooling | Free to low |
| Biggest blind spot | Delayed quality signals | Metric gaming and over-measurement | Social presence without delivery proof |
How to Choose Between These Three
You need at least 2 of these models running together. A single scorecard approach leaves blind spots that compound month over month.
Agencies running fewer than 5 outsourced projects per month should start with a retrospective scorecard and add social signal scoring for new partner discovery. This combination costs nothing, takes about 4 hours to set up, and covers both historical performance and pre-engagement screening. The lag problem remains, but at low volume, the risk stays manageable.
Agencies running 10 or more projects per month need the real-time KPI dashboard as a foundation. Layer social signal scoring on top for new partner evaluation. At this volume, a 60-day data lag can affect 8 to 15 client relationships before you catch the quality drop. The 2-to-4-week dashboard setup investment typically pays back within 1 quarter through avoided rework and client retention.
Whichever combination you pick, weight the models intentionally. A practical split for ongoing outsourced team evaluation: 50% real-time KPIs (or retrospective scores if you're pre-dashboard), 30% social and community signals, 20% qualitative feedback from your internal team. Adjust the weights based on relationship tenure. New partners should get higher social signal weight, around 40 to 50%, because you lack project history. Partners with 6+ months of delivery data shift toward 70% KPI weight as the hard numbers accumulate.
The velocity problem named in the title comes down to this: agencies vet too slowly because they wait for project data to pile up. Social signal scoring and real-time dashboards compress that evaluation timeline from months to days. Agencies that can produce a confidence score on a new partner within 48 hours of first contact win the best partnerships and avoid the worst ones. Slow vetting leaves you accepting risky partners by default because you didn't have enough data to say no. You can see how we approach quality standards across our own agency portfolio and the bar we hold white-label partners to.
Build the scorecard before you need it. The worst time to evaluate your white-label risk management practices is the week after a client site goes down and you're trying to figure out which partner was responsible for the breakage.