
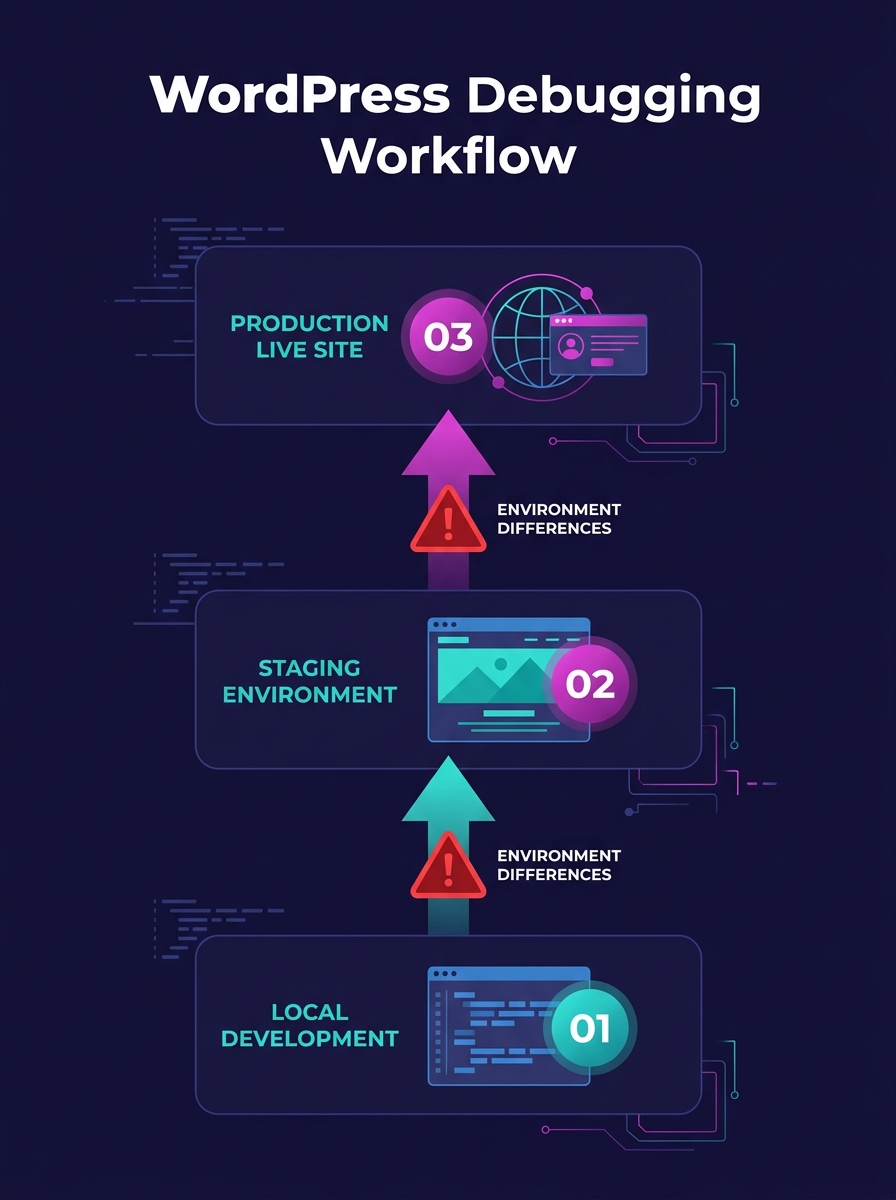
WordPress's "critical error" screen sends a 500 status code to Googlebot, and for white-label agencies managing dozens of client sites, the root cause is almost always the same: staging environments that don't match production. Closing that parity gap is the single most effective form of production environment troubleshooting an agency can invest in.
The Debug Log Era
For years, the default white-label WordPress debugging workflow looked identical across agencies of every size: enable WP_DEBUG in wp-config.php, reproduce the issue on staging, read the flat debug.log file, fix the offending plugin or theme code, push to production. ICDSoft's complete guide on WordPress error reporting documents this approach thoroughly, and it worked well enough when an agency ran 5 or 10 sites on similar hosting stacks.
The problem surfaced when agencies scaled past 20 or 30 clients. Each client site accumulated its own plugin mix, its own PHP version pinned by the host, its own caching layer (object cache via Redis on one, page cache via LiteSpeed on another, CDN-level caching on a third). The debug.log file on staging captured errors accurately for that specific environment. But "that specific environment" increasingly bore little resemblance to the production server where the code actually ran.
The consequences for SEO were direct and measurable. Every time a fix that passed staging QA triggered a fatal error on production, Googlebot encountered a 500 response. Google's crawl budget allocation punishes sites that return server errors consistently. A site returning 500s on 15% of crawl requests sees its crawl rate throttled, its fresh content indexed slower, and its rankings soften within days. For an agency billing a client for SEO results, a single environment mismatch could undo months of optimization work.
When PHP Mismatches Started Breaking Client Sites
The inflection point came as hosting providers began aggressively upgrading PHP versions. A staging site running PHP 8.0 would pass all tests, but the production server had already auto-updated to PHP 8.2. Deprecated functions that still worked on 8.0 threw fatal errors on 8.2. The result: a white screen on the client's live site, a panicked email, and a scramble to figure out why code that "worked in staging" was broken in production.
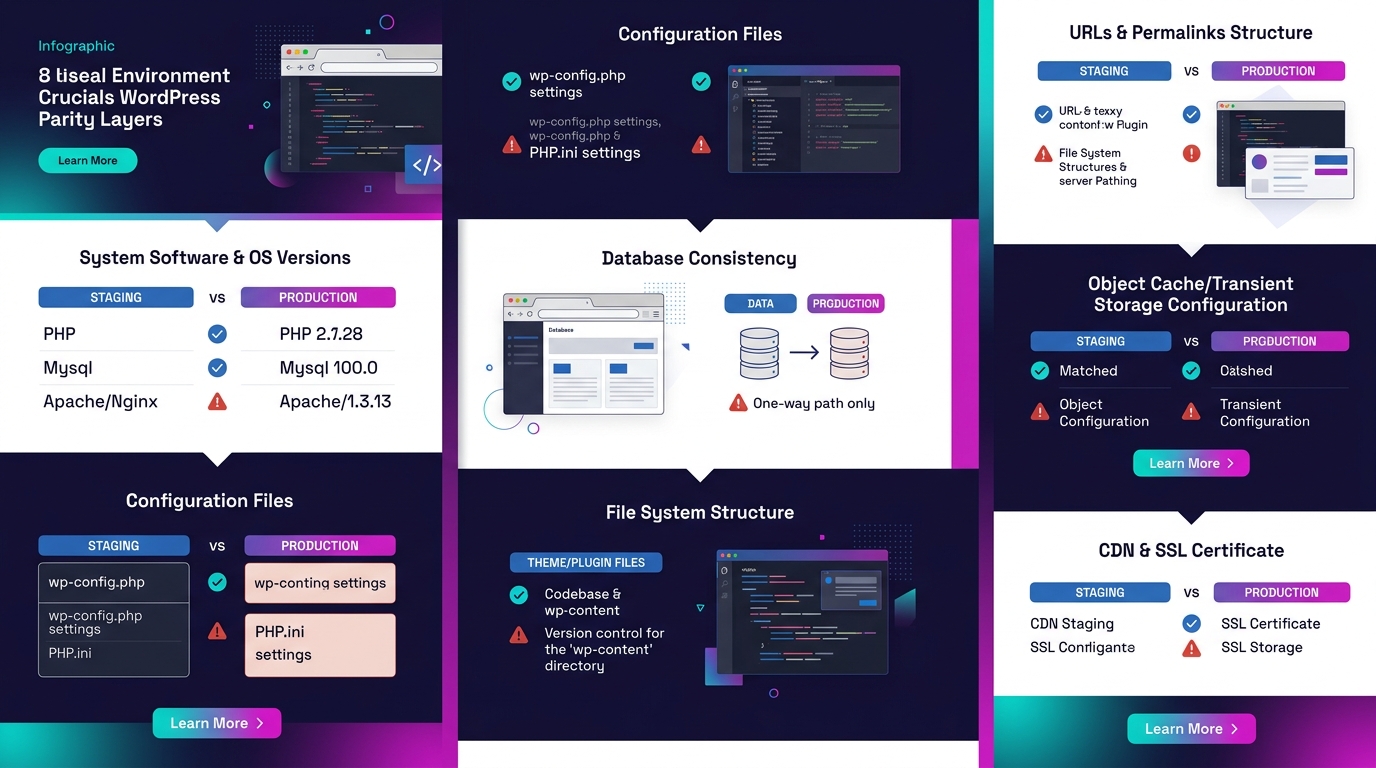
Pantheon's documentation on WordPress staging-to-production workflows spells out the minimum parity requirements: PHP versions and extensions, database engine and character sets (MySQL versus MariaDB settings affect queries and indexing), caching and CDN layers (Varnish, Redis, or edge caching all change site behavior), and TLS/HTTPS settings with domain configurations. Miss any one of these, and you're testing against a fiction.
The Roots team's Twelve-Factor WordPress guide frames this as Principle #10: dev/prod parity. Their specific warning targets backing services. Developers often use SQLite locally and MySQL in production, or local process memory for caching instead of Redis. These lightweight local substitutes behave differently under load, return different error types, and mask timing issues that only appear on production infrastructure. For agencies running automated performance regression detection, a mismatch in the caching layer alone can produce false baselines that make real regressions invisible.
The SEO impact compounds across a portfolio. An agency managing 50 white-label client sites with inconsistent staging parity isn't dealing with one broken site. It's dealing with a probabilistic failure rate across the entire portfolio, where any deployment to any site carries a non-trivial chance of introducing a production error that damages that client's organic visibility.
The Parity Checklist That Emerged
Agencies that got serious about client site error resolution converged on a standardized matching protocol. The checklist isn't glamorous, but it's the infrastructure that prevents the "works on staging" conversation from ever reaching a client.
| Parity Layer | What to Match | Common Drift Pattern |
|---|---|---|
| PHP version + extensions | Exact minor version (e.g., 8.2.18) | Host auto-upgrades production; staging stays pinned |
| Database engine | MySQL 8.x vs MariaDB 10.x; character set (utf8mb4) | Different hosts default to different engines |
| Object cache | Same Redis/Memcached version and config | Staging uses file cache; production uses Redis |
| Page cache / CDN | Same Varnish rules, same CDN provider | CDN bypassed on staging subdomain |
| TLS/HTTPS | Same certificate type, same HSTS headers | Staging uses self-signed cert or plain HTTP |
| Cron system | Same handler (wp-cron vs server cron) | Staging relies on wp-cron; production disabled it |
| File permissions | Same ownership model | Staging runs as root; production runs as www-data |
| WordPress version | Exact match, including minor releases | Auto-updates enabled on one but not the other |
WordPress.com's own staging documentation notes that staging sites share the same storage allocation as production, split 50/50 between the two. That storage constraint matters because disk-full conditions on production won't surface on a staging site that's using a fraction of its allocation. Agencies using managed hosting need to monitor storage consumption independently on both environments.
We've published a detailed staging-to-production parity debug checklist that walks through each layer with specific commands and verification steps. If you haven't audited your own environments against it, that's the place to start.
From Flat Files to Structured Logs
The debug.log file has a fundamental limitation for white-label WordPress debugging at scale: it's unstructured text. Grepping through a 200MB log file on a busy WooCommerce site to find the one PHP warning that preceded a checkout failure is slow, error-prone, and impossible to automate meaningfully.
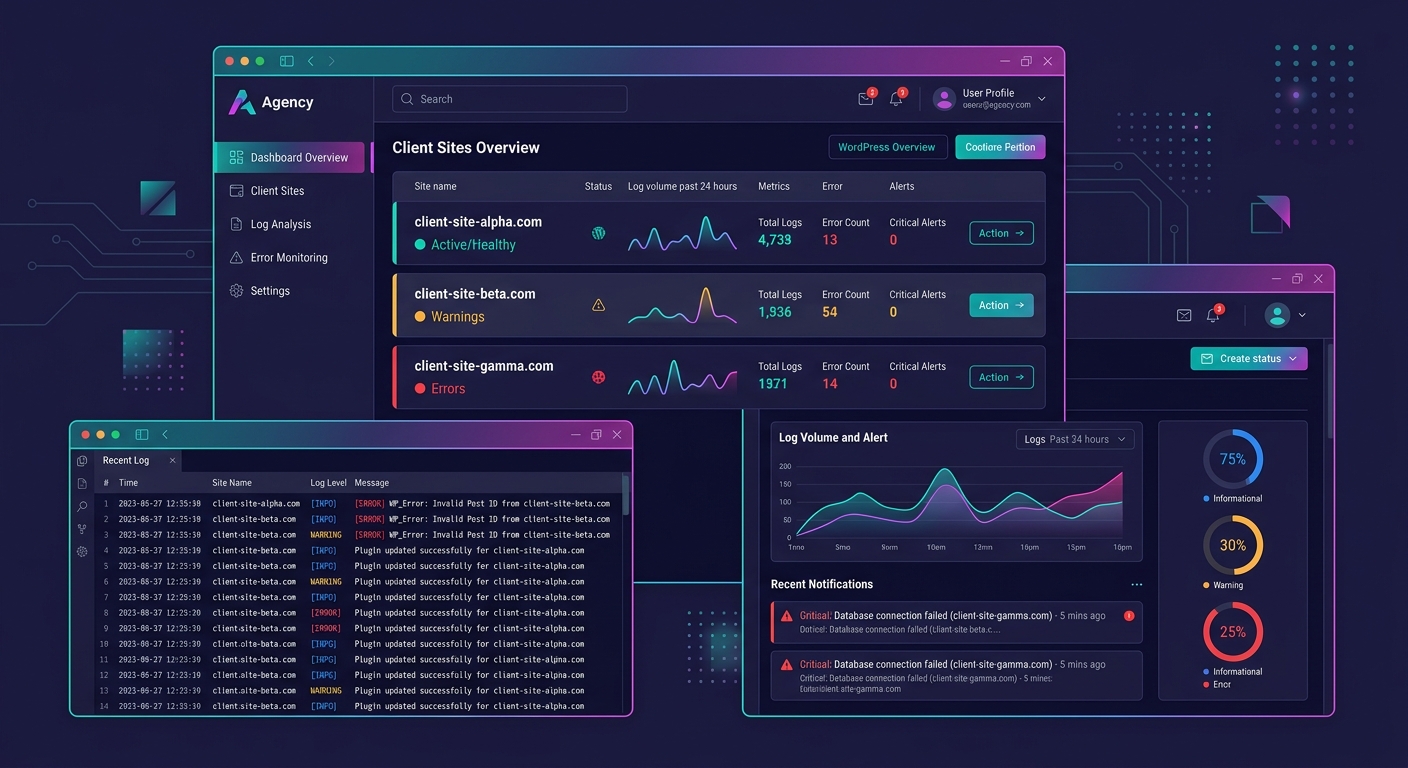
The shift toward JSON-structured logs changed how agencies diagnosed production issues. Instead of a flat line reading "PHP Warning: Undefined array key 'billing_email' in /wp-content/plugins/...", a structured log entry includes the site identifier, request URI, user role, timestamp in ISO 8601 format, and the full stack trace as parseable fields. That structure means a log management platform can filter, aggregate, and alert programmatically.
The gap between staging and production is where client trust goes to die. Every 500 error Googlebot encounters is an SEO regression you didn't authorize.
Shipping these logs to a centralized platform via agents like Fluentd or Filebeat gives an agency a single pane of glass across the entire client portfolio. When a new plugin update introduces a deprecation warning across 12 sites simultaneously, the pattern surfaces in minutes instead of trickling in as individual client complaints over the following week.
For agencies considering whether this infrastructure investment makes sense, the economics have shifted dramatically. OpenObserve offers 140x lower storage costs than Elasticsearch for log, metric, and trace ingestion. That cost difference turns portfolio-wide logging from a prohibitive expense into an operational line item that fits within existing margins. Some agencies have started reselling monitoring access as white-labeled dashboards, generating $50 to $150 per month per client as a standalone revenue stream.
Observability Platforms Changed the Math
Structured logs answered the "what happened" question. The next gap was "why did it happen," particularly for performance-related SEO problems where no single error appears in any log. A page that loads in 6.8 seconds doesn't throw a PHP error. It passes every functional test on staging. But it fails Google's Largest Contentful Paint threshold of 2.5 seconds, and the client's rankings slide.
OpenTelemetry PHP auto-instrumentation captures request traces and database query latencies without requiring code modifications to the WordPress application itself. An agency can instrument a client's production site, identify that a shipping rate API call during WooCommerce checkout takes 3.2 seconds on average (compared to 400ms in the sandbox environment used on staging), and pinpoint the exact cause of the slow page load.
Tip: Configure Slack alerts for any production 500 error that persists for more than 2 consecutive requests to the same URL. This catches intermittent failures that debug.log silently rotates away before anyone reads the file.
This kind of production environment troubleshooting feeds directly into environment parity management at scale. When you can see the actual response times, database query counts, and external API latencies on production, you can recalibrate your staging environment to replicate those conditions. Parity stops being a checklist you verify once and becomes a living measurement you track continuously.
Agencies that need dedicated WordPress developers with observability experience are increasingly specifying OpenTelemetry familiarity as a hiring requirement. The skill set for white-label WordPress debugging has expanded beyond PHP proficiency into infrastructure monitoring territory.
The State of Play
The WordPress staging parity problem hasn't been solved. It's been systematized. Agencies that treat environment matching as a deployment prerequisite rather than a troubleshooting afterthought report fewer client-facing incidents, faster resolution times when issues do occur, and measurably better SEO outcomes across their portfolios.
The current best-practice stack for white-label agencies looks like this: local development via Local or DDEV, a staging environment matched to production across all 8 parity layers documented above, JSON-structured logging shipped to a centralized platform, OpenTelemetry tracing on production for performance diagnostics, and automated alerts that notify the team before the client (or Googlebot) encounters repeated failures.
The WP Services white-label maintenance scaling guide for 2026 emphasizes staging environment testing and verified backup procedures as core components of any maintenance framework. Agencies that have experienced quality inconsistencies with freelance marketplace sourcing find that vetting partners on environment parity practices eliminates an entire category of deployment risk.
What's changed most significantly is the economics. The infrastructure that makes this level of WordPress staging parity monitoring possible used to cost thousands per month in log storage and APM licensing alone. OpenObserve, Grafana Loki, and similar open-source platforms have dropped that cost by orders of magnitude. An agency managing 40 client sites can run production-grade observability for less than the monthly cost of a single premium plugin license per site. The barrier is no longer budget. It's process discipline, and the agencies that build that discipline into their deployment workflow are the ones whose clients' sites stay indexed, stay fast, and stay ranked.