
With a wealth of metrics available on different analytics tools, how do you know which ones are actually important to the bottom line of your business? And how should you go about measuring the impact of your digital marketing campaigns?
This article discusses specific digital marketing metrics and key performance indicators that all marketers should focus on and why they’re important to you.
What are digital metrics?
Digital metrics, often referred to as key performance indicators (KPIs), are values commonly used by marketers to measure and track the performance of their campaigns. These quantifiable values help to set expectations and to see if their efforts are having a positive impact.
With the amount of tools, channels, and techniques marketers use to promote their brand, products and services, identifying which metrics to keep an eye on is essential to determining targets and goals.
What are vanity metrics?
Speaking of digital metrics that matter, it’s equally important to differentiate them from vanity metrics.
Vanity metrics are quantifiable data that look great (or otherwise) on paper, but don’t necessarily have an impact when it comes to the big picture. To the uninitiated, these can look to be a measure of success, but seasoned marketers would know that they don’t really affect the bottom line. Vanity metrics also don’t help you understand how your campaigns are performing, which means it can’t give you insight for future strategies.
But as pointed out by Tableu, any metric can be considered a vanity metric—that is, if they aren’t put into context. For example, X amount of website traffic could very well then be meaningless when taken on its own. But when you start to segment it into things like organic, direct, referral, social, and paid – it can help you identify opportunities for your company. Looking at these different types of traffic can, for example, can tell you whether you should focus on brand awareness or increasing social engagement.
Here are some other examples of vanity metrics:
• Registered accounts – Having 10,000 registered accounts can be meaningless if you only have 100 active monthly users.
• Page views – If the page, for example, is a landing page for an ebook download – what good would 100,000 page views be if there’s a miniscule amount of downloads?
• Number of page likes/follows – While no one would say no to a million Facebook followers, what good would that be if your posts regularly gets just around 100 likes and even fewer engagement?
So when you ask yourself “what are the most important marketing metrics?” The answer often relies on the metrics’ ability to consistently provide you with context, measure performance, and help you make informed decisions in the future.
Top 20 Digital Marketing Metrics That Matter
Traffic
As alluded to earlier, traffic at face value is essentially a vanity metrics. But broken down into segments, it’s a valuable digital marketing metric to monitor. The five channels that you should segment your traffic into include:
• Organic – Visitors who came to your website because it showed up on a search engine results page (SERP).
• Direct – Those who typed in your URL to get directly to your site.
• Referral – Those who reached your website from another website via link.
• Social – Those who were directed via social media.
• Paid – Those who clicked on a paid ad or promoted piece of content.
Fortunately, most content management systems (CMS) allow you to dissect your traffic by source. Doing so enables you to do things like:
• Find out which pieces of content drive the most traffic.
• What actions visitors are taking on your site.
• Where most of your visitors are dropping off.
• Point out opportunities to optimize specific portions of the user journey.
Speaking of the user journey and opportunities, it would also be wise to pay close attention to new vs. returning visitors.
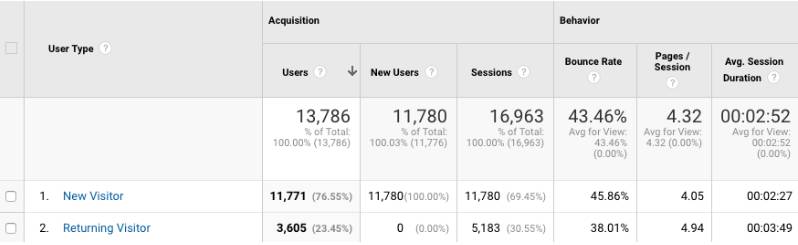
This is helpful because it lets you know which visitors are more likely to convert as returning visitors are obviously interested enough to have come back to your site. If you’re not getting enough new visitors, it could mean that you need to work on things like SEO, social media marketing, or your content strategy as good content is a major factor in visitors returning. As noted by Envision-Creative, you should aim to have around 25-50% of your total number of visitors to be returning visitors.
Additionally, you should also look at your mobile traffic, as nearly 80% of internet usage was mobile in 2018. More and more people are on the go, so having a solid mobile presence, with a mobile-optimized website is crucial in these modern times.
Engagement metrics
Essentially, these types of digital marketing metrics let you know how much people are engaging with your digital assets – be it your website, social content, or ads. Having high rates of engagement are important because they allow you to build and cultivate relationships with your audience, enabling you to usher them favorably through the user/customer journey.
Here are some of engagement metrics to track:
Average Time on Site
This metric gives you a good idea of how well you’re engaging visitors across your site. As such, it can help you see where you can improve specific things like poor navigation and content quality. For example, if you have an ecommerce site and find that users spend a lot of time on your product pages but have high rates of cart abandonment, it could be that your checkout process is complicated or there aren’t enough payment options.
It’s also important to note that desktop visitors typically spend more time exploring a website than mobile users, as those on mobile often need to find what they need quickly, as opposed to desktop users who are more thorough in their searches.
Bounce Rate
The bounce rate is the percentage of visitors that leave your website almost immediately after getting there. This refers to users that get to your website but do not engage at all – not clicking on any links and leaving soon after. Obviously, the less time a visitor spends on your site, the less chances you have of converting them. But that’s not all, a high bounce rate can also affect your SEO rankings, which makes it something you need to keep a close eye on.
These can also tell you certain things. Perhaps the external link directing them to your site doesn’t have an accurate description. Or maybe you’re not using keywords that are relevant to the content on that particular page. If visitors aren’t finding what they expect to when they get to your site, they will leave right away.
Net Promoter Score
NPS basically measures customer experience and their willingness to recommend a company and its products and services to others. It is often used as a proxy for gauging customers’ overall satisfaction with a company and its products, as well as their loyalty to the brand.
It’s also acquired pretty simply, by surveying customers on a scale of 0 to 10 how likely they are to recommend a company to a friend or colleague. Then, based on their ratings, customers are classified into three categories: detractors (lower or equal to 6), passives (7-8), and promoters (9-10). The NPS is determined by subtracting the percentage of customers who are detractors from the percentage of promoters.
Conversion Metrics
Conversion metrics indicate the rate of people taking a desired action. These are some of the most important metrics to track because they have a close link to every business’ bottom line – which is to earn profits. These include:
Conversion Rate
As defined by Search Engine Journal, conversion rate is the amount of visitors who’ve completed a goal on your website. Note that there are many kinds of desired actions you can have on your website. It could be having visitors filling up your opt-in form. It could be downloading a piece of content. And of course, it could also be purchasing a product or service. According to Word Stream the average conversion rate across all industries is 2.7%.
Here is the simplest way to compute your conversion rate:
Conversion rate = (conversions/total visitors) * 100
So if you had 100,000 visitors and 5,000 conversions in a month, your conversion rate is 5%.
Apart from telling you your conversion rate, this also indicates the effectivity of your website elements. A conversion rate that leaves much to be desired, on the other hand, can signal that you need to do a better job of optimizing things like your landing pages, calls to action, and overall website design.
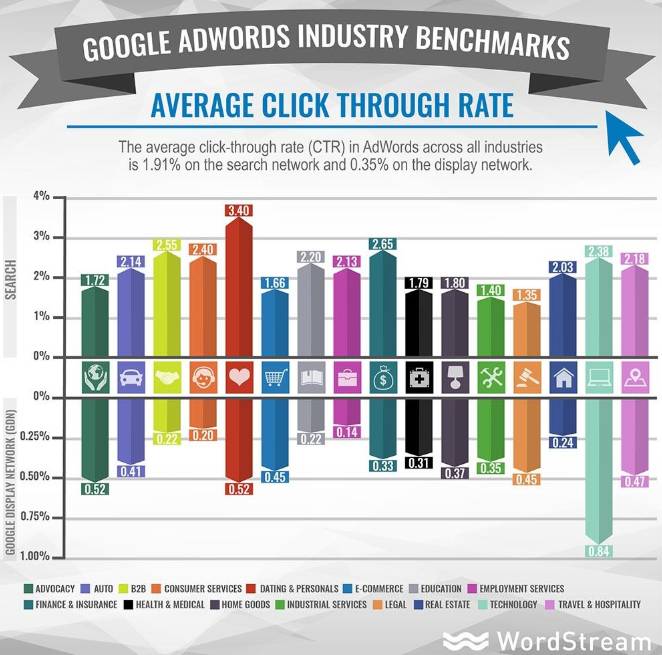
Click-Through Rate
This digital marketing metric, often referred to as CTR, is one that measures the number of clicks advertisers receive on their ads per number of impressions. Basically, it’s the percentage of people who view your ad and then actually go on to click the ad. The basic formula to derive the CTR is:
Total clicks on ad / Total impressions
A high CTR indicates a successful pay-per-click (PPC) campaign as it directly affects not just your Quality Score, but also how much you pay every time a user clicks your search ad. As pointed out by Word Stream, if you’re advertising on relevant queries, achieving a high CTR means that you are driving the highest possible number of people to your offering.
Cost per Lead
This KPI measures how cost-effective your campaigns are when it comes to generating new leads. To wit, a lead is a potential customer that has expressed interest in your product or service by completing a goal. Tracking this provides marketers with a tangible dollar figure, giving them an understanding into how much money is appropriate to spend on acquiring new leads.
Additionally, your cost per lead is a crucial factor in computing your campaigns’ return on investment.
Cost per Click
This is basically the actual price you pay for each click in your PPC campaigns. As a note, a click on your PPC text ads or display banner ads represent a visit or an interaction with your offering. Each click in a PPC campaigns indicates an interest from a user searching for something that you’re offering. It is exactly this sort of interest and attention that you’re paying for as an advertiser.
The cost per click in AdWords is computed as such:
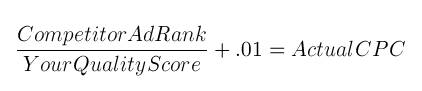
As noted by Word Stream, your cost per click will always be less than or equal to your maximum bid because it is essentially an average of bids against a series of competitors over a period of time. With how Google’s AdWords auction system works, your actual cost per click is heavily influenced by your and your closest competitor’s ad rank, maximum bid, and Quality Score.
And similar to cost per lead, this is also a significant factor in computing your marketing ROI.
Revenue Metrics
Customer Lifetime Value
Customer Lifetime Value (CLV) indicates the amount of money a customer is expected to spend on your business during their lifetime. As noted by Shopify, this is an important metric to keep an eye on because it aids your decisions on how much to invest in acquiring new customers as well as retaining existing ones. So, for example, if you determine that a customer’s CLV is $700, it wouldn’t be wise to spend $1,000 to acquire and keep them.
Here’s a simple way to compute the CLV:
CLV = Average value of a purchase * Number of times the customer will purchase in a year * average length of customer relationship (in years)
Here are some of the other things the CLV can tell you:
• What kinds of products customers with the highest CLV want.
• Which products have the highest profitability.
• Which types of clients are the most profitable.
Having this kind of insight allows you to make decisions that have a greater chance of boosting your profitability.
Customer Acquisition Cost
Speaking of which, this is in its most basic sense, the cost of convincing a potential customer to purchase from you. This metric, as you might imagine, is integral to business success. Everyone wants to have as many customers as possible, but not at the expense of going broke.
But to dive into CAC more specifically, when it comes to this KPI – it doesn’t matter where the lead came from – this metric is a catchall that takes into account the entire sales and marketing spend over a certain period of time, relating to how many new customers were acquired in that same period.
Here’s a simple sample computation:
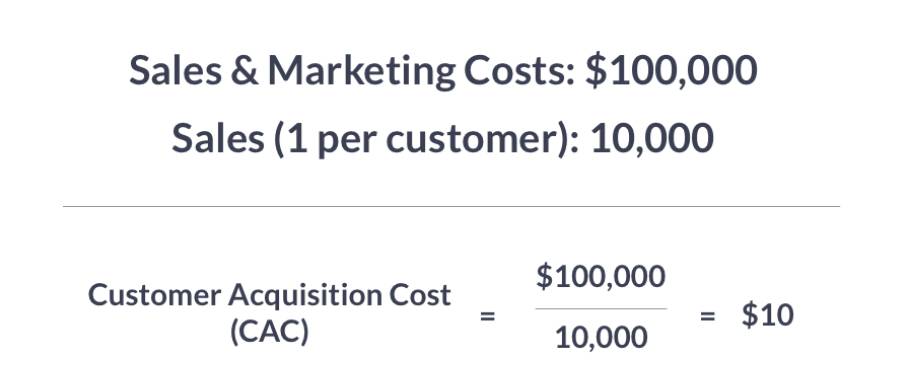
So in the example above, sales and marketing costs could include everything from salaries, to ad spend, to marketing events.
CLV to CAC Ratio
Of course, while the two above metrics can be insightful on their own, they’re even better combined. The CLV to CAC ratio serves as an excellent barometer for a business’ health, as it gives valuable insight into its efficiency.
So for example, if you have a CLV to CAC ration of 5:1, it means that for every dollar you spend, you get $5 in customer value. This hypothetical number is a great one as the industry standard for growing SaaS companies is at 3:1.
As a note, your CAC must be measured over a specified period of time, and has to account for the time it takes for a lead to become a customer. This is so, because say, you hold an event in March that gathers a good number of qualified leads. Those leads may not convert until the end of the second quarter. So if you were to look at your CAC just for March, it wouldn’t be an accurate reflection of your efforts.
It’s also important to note that CAC will not be the same for every business. As noted by Proof, while the CAC industry standard for travel and retail might just be at $7 and $10 respectively, it shoots up to $80 and $141, respectively, for ecommerce, and marketing firms. This is because the CAC is dependent on things like sales cycle length, purchase lifespan, and CLV.
Meanwhile the CLV is based on things like average purchase value, average purchase frequency, and average customer lifespan.
Customer Retention Rate
As the name implies, customer retention rate (CRR) represents the percentage of customers the company has retained over a specific period. This KPI is important because it costs as much as seven times more to acquire a new customer than it does to retain an existing one. Additionally, it is the existing customers who are more likely to be loyal to your brand, and may even become advocates. They’re also 50% more likely to try a new product, and spend 31% more, on average, than a new customer.
Here’s a simple formula:
CRR = ((E-N)/S)) * 100
Whereas:
E = The number of customers you have at the end of a particular period.
N = The number of new customers you made a sale to or acquired in some other way during a given period.
S = The number of customers you had at the start of the period.
By keeping tabs on your CRR regularly, you can get insight on the following:
• The likelihood of keeping each newly acquired customer.
• How long you’ll be able to retain each customer.
• Potential company growth.
• Signal a problem with your product/service.
• An issue with customer service.
• A burgeoning competitor.
Revenue per Visitor
While this metric is more related to traffic, it ultimately is tied to revenue. This is basically the amount of money generated each time a customer visits your website. To calculate it, you basically divide the total revenue by the total number of visitors you have. And its importance is in being able to place a number on the value of each visitor.
Meanwhile, it’s important to note that RPV can also be a KPI that doesn’t always provide an accurate reflection of your efforts. Because most website visitors don’t make a purchase, they will add up to a significant percentage of zero values when computing RPV.
Return on Ad Spend
One of the more direct metrics to measure, return on ad spend (ROAS) is simply the total revenue generated from a specific marketing channel, divided by the total spend on that channel. So if you spent $10,000 on paid search in the fourth quarter of 2019 and generated a revenue of $40,000 – your ROAS for paid search is $4.
Unlike other metrics that give you more of an insight as opposed to actual revenue numbers, ROAS is more straightforward in that it tells you how much revenue you’re getting for every dollar spent.
Return on Investment
And finally, this is what it all really boils down to. If you really want to get a clear picture of how the many different moving parts of your digital marketing machinations are impacting your business, you should be able to measure your digital marketing ROI.
While on the surface this is simply the measure of the profit or loss you generate from your digital marketing campaigns based on the money invested, it also shows you how effective your budget allocation is. If you don’t take the time and effort to measure your digital marketing ROI, you’re effectively taking a shot in the dark, blindly executing campaigns that you won’t have an idea of if it brings money in.
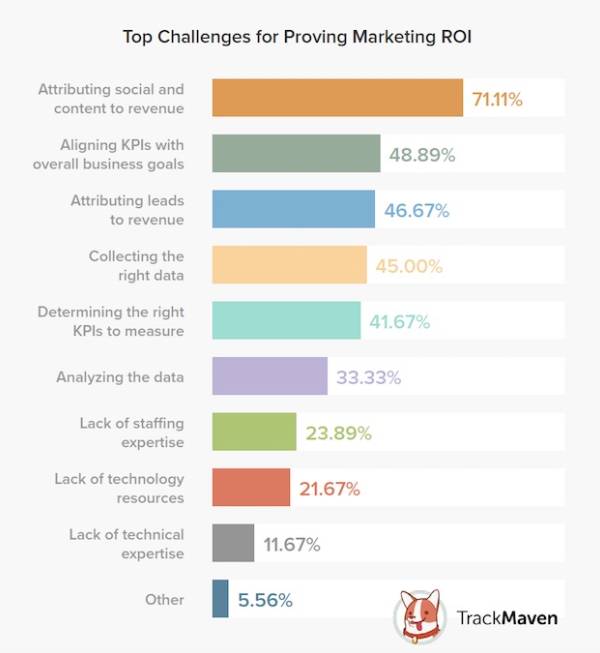
But of course, it’s not that easy, as you may have surmised. Below are some of the challenges when it comes to measuring digital ROI:
It’s important to note that not all campaigns have the end goal of conversion. There are those designed to build awareness, for example. But as pointed out by Lyfe Marketing, measuring your digital marketing ROI will largely depend on what your unique goals are. And with a good enough understanding of the different metrics that matter discussed above, it should make the process of measuring your digital ROI a little less tedious.
Tips for Measuring Your Digital Metrics Successfully
Choose metrics that align with your business goals
This is going to be key in determining the performance of your campaigns. With the vast ocean of available data, you’ll need to be precise in choosing the metrics that are the most closely linked to your established campaign goals.
For example, if your campaign goal is to increase consideration, you’re going to have to pay close attention to things like traffic, time on site, and lead generation rate. If you’re looking to improve customer satisfaction and advocacy, then you’ll be looking at things like customer review scores, account renewals, product return rate, and the like.
Select your tools
This is closely tied to what metrics you’ll be choosing to monitor and what your goals are. If your campaigns are just designed to increase awareness, then you should be fine with what Google Analytics has to offer. But if you’re looking to dive deeper into specific channels and specific KPIs entailed in those channels, then you might need to add something like SEMrush to your list of tools.
Again, if you have a good enough understanding of your goals and the metrics that will define your performance, then choosing the right tools will be much easier.
Choose your reporting foundation
This is easy to overlook with everything else going on in conceptualizing and executing campaigns, but it’s important to understand your current marketing landscape. To get started, you’ll need to establish benchmarks to see how you’re performing, and how your performance compares to industry benchmarks.
Turn data into valuable, actionable insights
You can have all the tools monitoring all the right metrics, but if you can’t translate that into concrete actionable insights, then your monitoring efforts would’ve been all for naught. Say you notice that you’re not getting enough traffic on your landing pages, and even on those that reach it aren’t converting enough. What does that tell you? Should you improve your content? Optimize your descriptions? Test more variations of your CTA buttons?
There are plenty of metrics to pat yourself on the back with. The real value lies in being able to do something with it.
Final words
Again, it’s easy to get swallowed by the ocean of data available these days. And it’s easy to get distracted by vanity metrics and other KPIs that don’t really provide an accurate reflection of your campaigns’ performance. But if you always have a clear understanding of what your goals are, you’ll learn to keep an eye on the metrics that have close links to what you’re trying to achieve. These will not only let you know how your efforts are paying off, but how you can further improve on them.