
The gap between a white-label agency that ships 200 WordPress sites a year and one that ships 200 good sites comes down to one operational habit: whether client project data feeds back into the production system or dies in archived Slack threads. This feedback mechanism, the Knowledge Extraction Framework, converts every engagement into a product improvement cycle.
The Raw Material Sitting in Your Project Archives
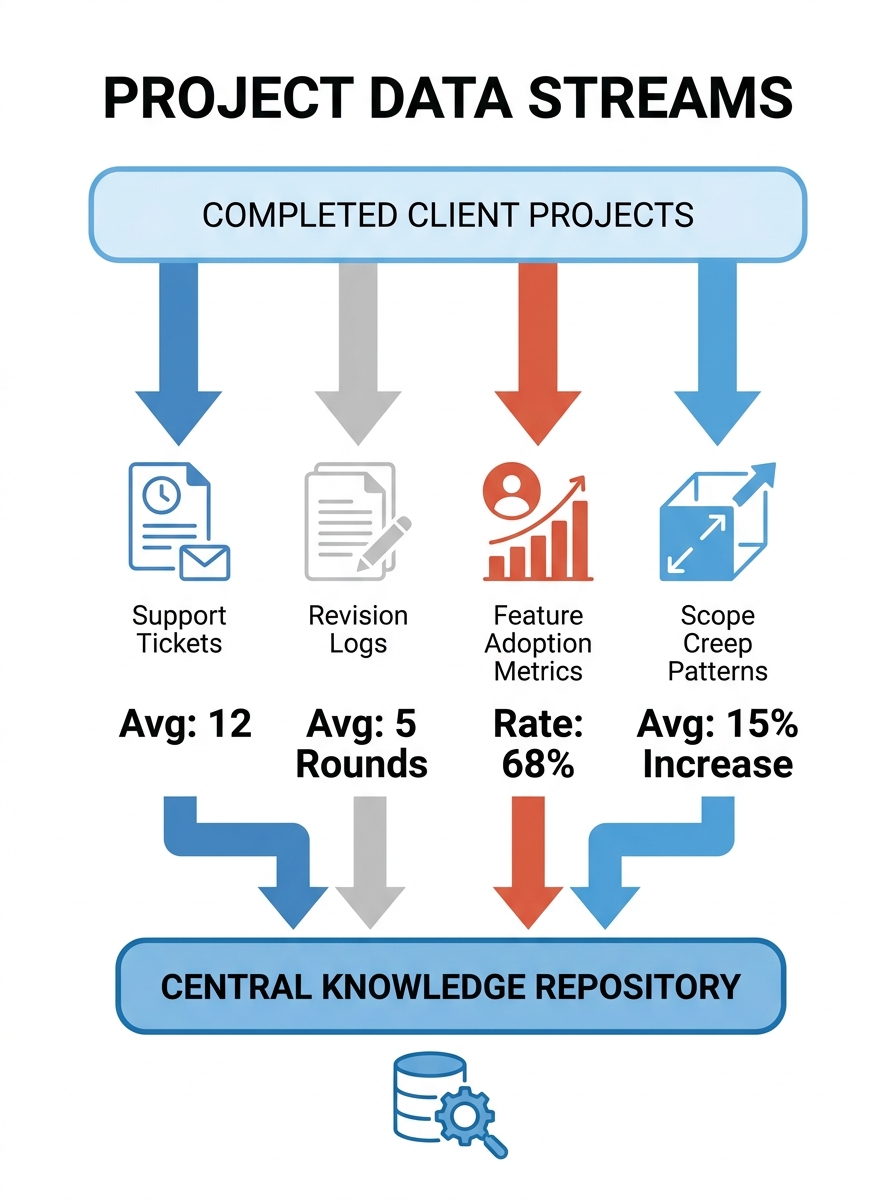
Every completed white-label WordPress build produces a residue of decision data that most agencies discard the moment a project board closes. Which component library modules clients actually used, which ones they asked to customize, where QA tickets clustered, what the average revision count was per page template. Agencies running 30+ projects a year accumulate thousands of these signals.
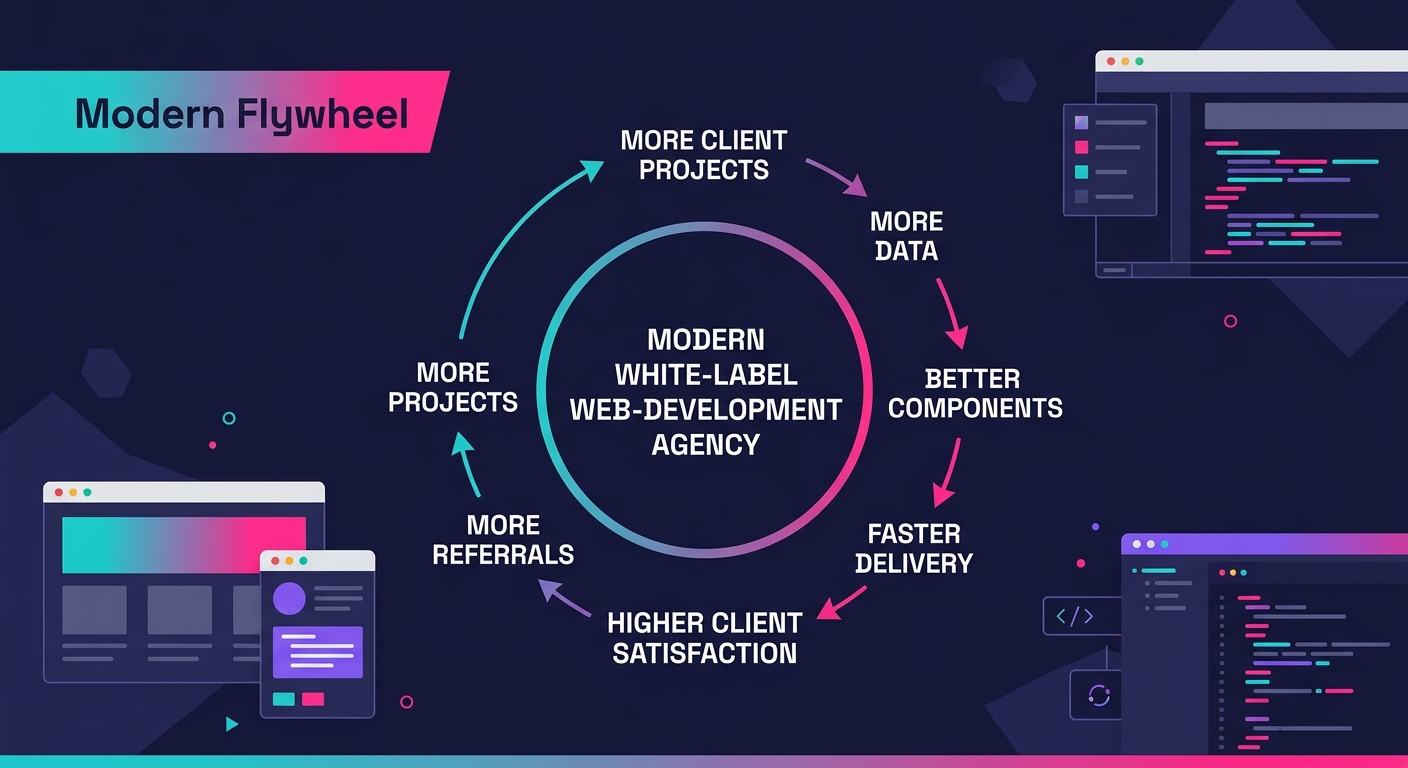
According to research from Harvard Business Review, the combination of user data and AI creates data feedback loops where firms that gather more customer data can feed it into algorithms to improve their product, attracting more customers and generating even more data. White-label WordPress agencies sit on exactly this kind of data and almost universally ignore it.
What does the raw material actually look like inside an agency running 40-60 concurrent projects?
- Support ticket categories: Which plugin configurations generate the highest volume of post-launch support requests per 1,000 page views
- Revision frequency: How many rounds of changes each component type requires before client approval (industry average hovers around 3.2 rounds for custom layouts versus 1.4 for templated ones)
- Feature adoption: Which blocks from your component library clients actively deploy versus which ones sit dormant across 80%+ of builds
- Scope creep patterns: Where projects consistently expand 15-25% beyond the original SOW, broken down by client vertical
When Informal Tracking Broke Down
For agencies handling 10-15 concurrent white-label projects, informal knowledge transfer works fine. The lead developer remembers that ecommerce clients always need the shipping calculator moved above the fold. The project manager knows healthcare clients require roughly 4x more revision rounds on form layouts than SaaS clients do.
This falls apart at 30+ concurrent projects. Institutional knowledge leaves when senior staff leave. New developers repeat mistakes that were solved months prior. And the pattern that emerges across agencies hitting this wall follows a predictable 3-step sequence: first, a costly mistake gets repeated on a client project. Second, someone creates a spreadsheet or Notion database to track "lessons learned." Third, that database goes stale within 8 weeks because nobody owns the update process.
The 2026 Toucan Toco white-label analytics guide highlights that leading platforms now include AI-powered natural language querying embedded directly in the analytics experience, with answers constrained by a governed semantic layer rather than generated from raw data. The distinction matters here: agencies querying their own project data need verifiable accuracy, because a hallucinated insight about component performance can send your entire library in the wrong direction.
White-label client intelligence requires structure before it requires tools. The agencies we've watched try to skip straight to dashboards without standardizing their data categories first end up with 47 different tag taxonomies across Asana, Jira, and Trello that no one can query meaningfully.
Building the Extraction Layer
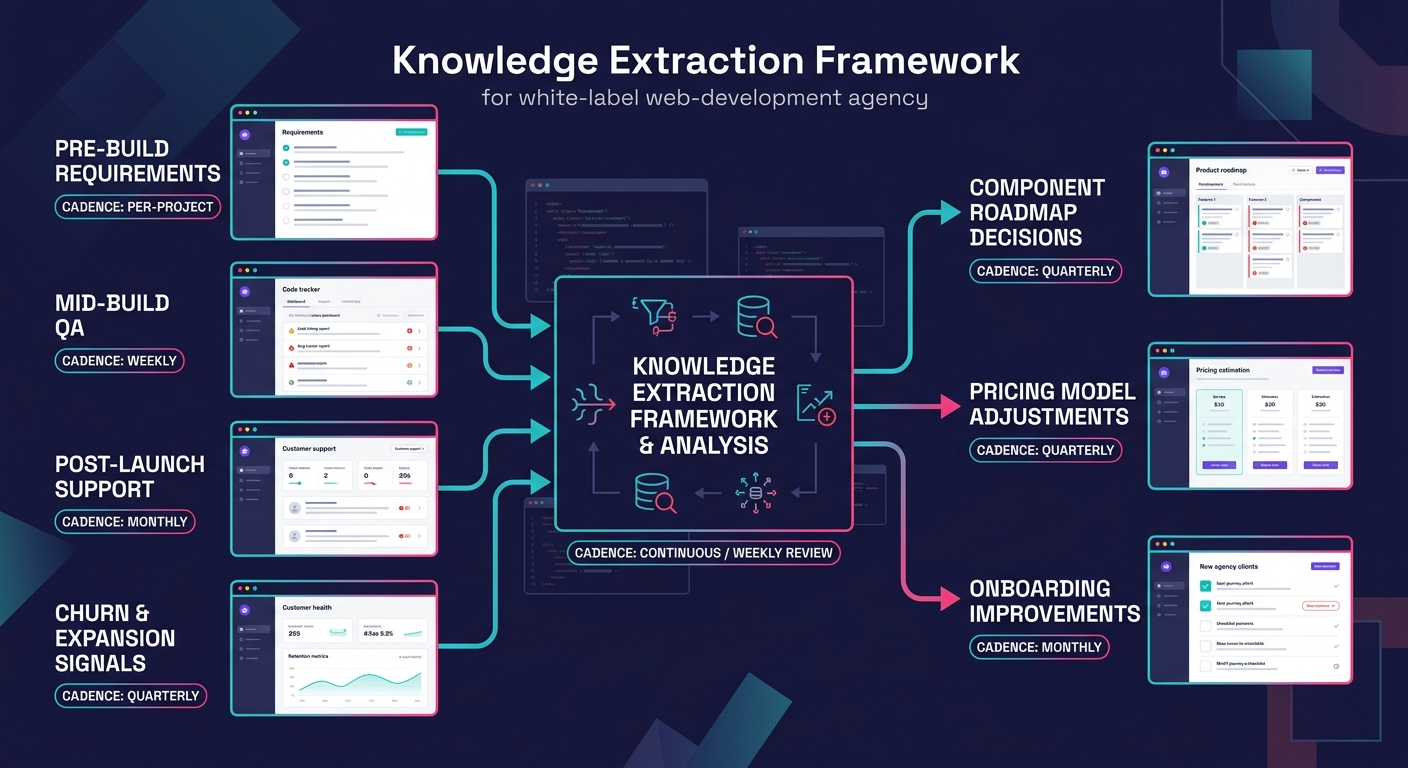
The extraction layer sits between your project delivery workflow and your product development process. It captures structured data from four sources at defined intervals throughout every project, using fewer than 15 standardized categories total.
Source 1: Pre-build client requirements. Tag every feature request and design preference in your project management tool with standardized categories. If you're running 50+ client brands through automated design system tokens, the token configuration data alone reveals which visual patterns your market gravitates toward. Track color palette frequency, typography selections, and layout preferences per industry vertical. After 25 projects in a single vertical, the dominant preferences become statistically clear.
Source 2: Mid-build QA and revision data. Track what category of issue each ticket represents, which component triggered it, and how many minutes resolution took. Tendril's research on feedback loop tooling identifies the essential stack: a centralized feedback repository, a customer communication platform, and an analytics dashboard for tracking trends and outcomes. Tools like Productboard or UserVoice handle the repository function, integrated with your existing CRM and support workflows.
Source 3: Post-launch support patterns. The first 90 days after a site goes live produce the most valuable WordPress agency customer insights. Which features break? Where do end users drop off? Mixpanel excels at tracking feature adoption rates and tying them directly to subscription renewals, connecting user drop-offs to churn patterns through cohort analysis. That data feeds directly into your component health assessments.
Source 4: Client churn and expansion signals. When a client doesn't renew, document the stated and suspected reasons in structured fields. When a client expands scope, tag which capabilities drove the expansion. Over 12 months of data, renewal-correlated features become obvious.
The Product Learning Feedback Loop Takes Shape
With extraction running, the product learning feedback loop requires three recurring processes to function. Each operates on a different cadence and produces a different output.
Weekly: Pattern flagging (30-45 minutes). A designated team member reviews the previous week's QA tickets, support requests, and client communications for recurring themes. The output is a ranked list of the 3-5 most common friction points across active projects. Week-over-week comparison reveals whether a pattern is growing or shrinking. If your contact form component generates 6+ tickets per week across 3 or more projects, that's a signal strong enough to act on.
Monthly: Component scoring. Score each module in your library on three axes. We call this the Component Health Score:
| Axis | Measurement | Source | Red Flag Threshold |
|---|---|---|---|
| Build Time | Average hours to implement across last 10 projects | Time tracking tool | Over 2x the component category average |
| Revision Rate | Average client-requested changes before approval | QA ticket data | Above 3.5 rounds consistently |
| Support Load | Post-launch tickets per deployment in first 90 days | Support platform | More than 2 tickets per site |
Components scoring red on all three axes are immediate candidates for redesign or retirement. Components scoring green across the board become your defaults and your sales talking points.
Quarterly: Product roadmap integration. The accumulated weekly and monthly data feeds into a quarterly review where leadership decides which components to rebuild, which new modules to develop, and which service packages to adjust. This is where white-label service optimization becomes concrete.
The agencies that treat every client project as a data collection opportunity end up with a compounding advantage: their 200th site ships faster and cleaner than their 50th because the product itself has learned from the previous 199.
A WordPress development partner that tracks which WooCommerce checkout configurations generate the fewest post-launch support requests can pre-configure those settings in their starter templates. The next 10 projects start from a baseline that already reflects real-world client behavior.
Scaling Through the Data Flywheel
The real inflection point comes when product learning feedback loops generate enough data to shift from reactive fixes to predictive decisions. Scaling through client data means your project estimates, component defaults, and QA checklists update based on evidence from 50, 100, 200 completed projects rather than one developer's memory.
Here's what predictive WordPress agency customer insights look like in practice: data from 100+ completed projects might reveal that clients in professional services request an average of 2.3 more page templates than ecommerce clients, but generate 40% fewer post-launch support tickets. That single insight changes how you scope and price professional services engagements.
Or you discover that projects using your standard header component ship in 12 fewer hours on average than projects with custom header designs, while showing no measurable difference in client satisfaction scores at 30-day and 90-day check-ins. That data point justifies making the standard header your default recommendation and charging a 20% premium for custom work.
The partner relationships you build with your white-label development team get stronger when both sides can reference shared data. Instead of subjective conversations about quality, you point to Component Health Scores and revision rate trends. And if you want to see how these feedback-informed processes show up in final deliverables, our website portfolio demonstrates the cumulative effect of iterative product refinement.
Tip: Start with your highest-volume client vertical. If 35% of your projects are ecommerce builds, standardize data capture for ecommerce first. Build the habit on a narrow slice before expanding categories across your full client base.
Where This Lands Now
WP Engine's AI toolkit now automatically detects, normalizes, and indexes a site's existing structured content and metadata, reducing the manual effort required to build an extraction layer. ChromaDB enables WordPress agencies to index client-specific content and retrieve relevant information dynamically. Pylon provides omnichannel support intelligence across Slack, Teams, email, and chat that can feed the post-launch support data source. The tooling has caught up with the operational need.
But the agencies actually running these systems share three characteristics that have nothing to do with which platform they chose. They've standardized their data capture into fewer than 15 categories. They've assigned ownership of the feedback loop to a specific person, usually an ops lead rather than a developer. And they've run the weekly-monthly-quarterly cadence without skipping cycles for at least two consecutive quarters before evaluating whether it's delivering results.
The Knowledge Extraction Framework is an operational commitment to treating client data as product R&D. Agencies that build the habit of structured data capture across 50+ projects find that their component libraries improve faster, their estimates land within 10% of actual hours more consistently, their per-project support costs drop by measurable margins, and their client retention rates climb quarter over quarter. The compounding effect is real, it's measurable, and it's available to any agency willing to close the loop between delivery and development.