
Print advertising has long died its slow, inevitable death, TV ad spend is down significantly from earlier in the decade, and even online advertising outside of social networks has become quite cumbersome. There’s a reason both brands and consumers have gravitated towards digital marketing. For brands, it’s because almost every effort can be tracked and measured. For consumers, it’s because of the more personalized experiences it brings.
But while no one can question the effectivity of digital marketing in terms of targeting and measuring results, it’s not quite as clear cut when it comes to one of the most popular channels in marketing—social media.
Though it seems like virtually every brand has some sort of social media presence, 44% of CMOs say that they haven’t been able to measure the impact of social media on their business, while 36% say they have a qualitative sense of its impact, but haven’t been able to translate it into solid figures. And it’s not just brands that are faced with the conundrum. Of those frequently tasked with it, marketing agencies, 55% say they can measure social ROI only “somewhat.”
And in today’s world of clear-cut, on-demand results, “somewhat” just won’t cut it.
The challenges
Apart from being a relatively new channel, the broad scope of social media marketing and its effects make it difficult to quantify its effects on the bottom line. When a particular campaign’s goal is to, say, increase awareness, engagement, or build relationships – how do you measure its impact on revenues?
And then again, the bottom line may not always be as transparent as sales and profits. Because a social media strategy is crafted (or at least should be) depending on a particular organization’s objectives, social media ROI can also be equivalent to the sum of all social media efforts that create value.
Marketers have become well-versed with creating dynamic, engaging content. But even when a piece of content trends on social media, or a particular post captivates an audience, how does that really translate into sales? Sure, it will almost certainly impact it in a positive way, but quantifying it is another story entirely.
The safest approach is to tie it with business objectives, but as studies have found, even some of the bigger brands and agencies are struggling with pinpointing where social media fits in the big picture.
What is social media ROI?
In its most basic sense, social media ROI is defined as the measure of the efficiency and effectivity of a social media campaign. That may sound simple enough, but where it gets tricky is when you factor in how ROI is defined.
For most businesses, ROI is the measure of the financial efficiency of an investment. Basically, the return minus the investment divided by the investment equals the ROI percentage. (ROI% = (return – investment) / investment).
When you only have two basic inputs (return and investment), it’s easy enough. The problem in calculating social media ROI is that while the investment (the resources you put into a particular campaign) may be clear, attaching a dollar value to the return is not as simple.
For example, when you’re looking to expand reach and you gain 10,000 more followers because of one campaign, how do you value that? Or maybe produce a video designed to educate your audience about a new product line. Let’s say it achieves the number of views you set out for it, what’s the ROI on that? Was it worth the resources you spent producing the video and promoting it on social media?
These types of returns make measuring social ROI not as clear cut as marketing endeavors that directly affect revenue.
Why measure your social ROI?
Producing content isn’t always as easy as snapping a nice photo and coming up with a witty caption. And even then, you’re going to need a dedicated team to create, curate, and produce content. None of those are free. Proving social ROI is a sure fire way to get management to keep giving you access to resources for social media marketing.
You can show them the likes, the hearts, maybe even the shares – but for stakeholders, those don’t really do much to move the needle. Quantifiable figures affecting the bottom line do.
Here are some of the other reasons why you should measure social ROI:
• It can show the potential impact of future social media marketing campaigns across the business.
• It can pinpoint where efforts and resources are most impactful.
• It can help better understand what resonates with your audience.
• It allows you to pivot when a certain approach isn’t quite performing as expected.
Essentially, you should measure your social media for the same reason you need to measure the return from all business efforts. You want to know if it was well worth it, and where you can further improve.
7 Steps to Measure Social Media ROI
1. Define your goals
As alluded to earlier, social media is a great medium to accomplish a number of marketing goals and objectives. And while some of those are what make it hard to quantify social ROI, defining them is also where you start the process of measuring its return. Here are some of the more common objectives:
Increasing brand awareness
The metrics tied to this are your social channels’ follower and engagement growth, as well as mentions over a specific period of time. It’s important to have a timeframe for determining brand awareness, so you can more easily gauge growth.
Attracting website traffic
While it’s tempting to measure overall traffic, that also makes it hard to see where your social efforts are actually contributing to. Instead, choose specific pages or sections to target. It could be a particular product category page, the blog section, or the contact page. Whatever it is, know that this will help you determine where to push your social followers. It will also make it easier to measure the traffic and track the referral source.
Generate new leads
With social media, there are a myriad of ways to generate leads. These include:
• Subscribing to an email newsletter.
• Signing up for an event or webinar.
• Downloading content (ebook, whitepaper, etc.).
• Filling up a contact form for things like a trial or consultation.
To get your followers to do any of the above, you need to include a link to a landing page with contact and sign-up forms. From there, you can track how many forms were filled out from a particular social media referral source.
If you want to dive a little deeper, you can also track post clicks and come up with your own formula for computing the conversions and acquisition rate per lead.
Find influencers to collaborate with
These days, brands almost need to work with influencers at one point or another. And because influencers are on social media for the most part, it’s a great space to start and build relationships with different influencers. Just make sure that the ones you choose to partner with are aligned with your branding and your values.
Once you find the right influencer to partner with, you could also provide them with a unique referral code/link, so you can track how much traffic, clicks, leads, or conversions you get from them.
Generate X sales
As you may have noticed in the subheading, you need to identify exactly how much sales you want to generate, as well as what kind of sales. For example, if you’re a sneaker retailer, and you’re about to run a campaign for the start of the NBA season, a realistic goal would be to generate 50 basketball sneaker sales on Instagram in the two months leading up to the season opener.
You’ll notice this to be a recurring theme during the course of this article. You need to be specific when setting goals – in this case, by picking the exact product/service you’re generating sales for, and how many sales you want to achieve.
2. Benchmark your current social measurements
Of course, before you can track anything, you need to see where you’re coming from – and that’s by conducting a social audit so you can benchmark where you’re starting. Here’s a simple way to go about it:
• Make a record of existing website analytics. This includes thinks link visitors, referral links, SEO rankings. And just as we did above, when you measure visitors, for example, it has to be for specific pages or parts of your website. When it comes to referral links, it would be best if you could do it per channel.
• Take note of the number of followers you already have on each social channel, as well as the engagement rates you’re currently getting.
• As well, make a note of the KPIs you’re currently tracking. Only this time, step outside the social media plane. Take a look at things like your total annual sales, average sales per month, cost of customer acquisition, social media marketing budget, total marketing budget, and things of that nature.
• You can also record current customer satisfaction scores on directories like Google My Business recommendations, Facebook, and the like.
Taking these things into account will allow you to track growth as your campaign rolls along and how your efforts compare to your benchmarks.
3. Identify your KPIs/Metrics
Just as you identified your goals and objectives, you need to choose the metrics that you’re going to measure your performance by. Doing this early on enables you to narrow down your focus when it comes to tracking your social media efforts’ performance.
Vanity vs. Meaningful metrics
Vanity metrics has also been alluded to earlier. Often referred to as low hanging fruit, these are metrics that, while satisfying on paper, doesn’t actually do much in terms of business goals. These include things like social media followers, page views, likes, retweets, etc. Yes, these offer positive reporting, but provide little else in terms of context for future marketing decisions. Alternatively, this is something actionable metrics can do.
Actionable metrics
Engagement rate
Anyone who’s been keeping an eye at social media marketing for the past few years know that brand’s organic reach has declined greatly since Facebook’s landscape altering algorithm change. As such, in 2017, engagement rates for branded Facebook Pages declined by over 20% since the changes were implemented the year before.
This means that while you may have 20,000 likes on your page, the reality is the number of people who see branded social media content has been on a steady decline. So instead of looking at Facebook followers, use Facebook Insights to check with posts generate the highest level of engagement. This means focusing on comments and shares of specific posts. The higher the level of engagement, the higher your EdgeRank score will be. Because this is essentially the SEO for Facebook newsfeeds, the higher your score is, the more people get to see your posts.
When you find which posts have the highest engagement rates, come up with a content strategy to replicate those high-performing posts. This will give you inspiration to come up with similar posts that resonate with your followers.
The same is true for Twitter. Follower count doesn’t really mean as much as it did back in the day. HubSpot recommends adding a “+” at the end of any bit.ly link or using the WhoTweetedMe.com tool to see who retweets your content, while also enabling you to identify influential followers. Additionally, to find out what your followers are talking about, you can use Cadmus to see their most shared links.
Bounce rate / Social shares
Blog post page views are good indicators that you’ve established yourself as a go-to resource in your respective niche. It also either says that you have good SEO practices, have good content, or both. What it doesn’t say is where the traffic is coming from, if the readers where able to find what they were looking for, or how long they spent on the page.
Instead of page views, focus on bounce rates and social shares. Bounce rate refers to the percentage of people who visit one page on your website and leave without clicking on anything else. To combat this, you need to keep your readers’ attention by providing visible links to other related content on your site, and by providing a solid CTA (call-to-action). If you see that your bounce rate is declining, it shows you that your audience is becoming increasingly interested in your entire blog.
When it comes to social shares, you should pay attention to it because search engines now consider tweets and Facebook shares in their algorithms. If you find that page viewers with social referrals are also sharing your content on their own social networks, then you know you’ve got something good going on.
Additional metrics you need to keep an eye on
Clicks to website by source – Tools like Wicked Reports provide you with a simple but detailed look into which social media channels your website visitors are coming from.
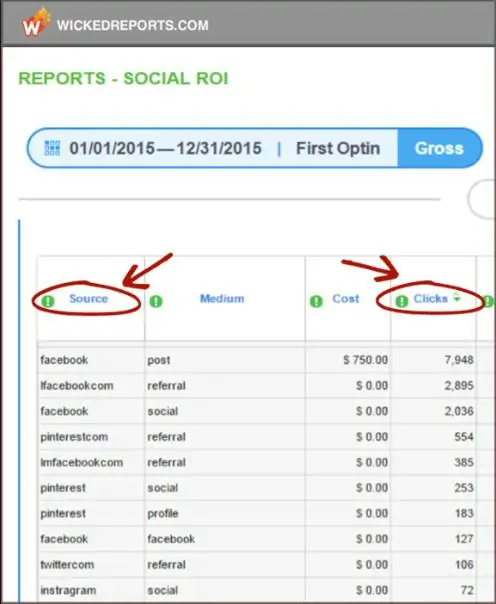
Email opt-ins by source – Similarly, you can use the same tool to find out where your new subscribers got their referrals from.
First click attribution – This is part of DigitalMarketer’s four attribution models for determining sales by source. As the name implies, first click attribution is the determining the very first click that brought someone to your site. In this model, if the first click comes from one of your social networks, then that source gets credit for the sale.
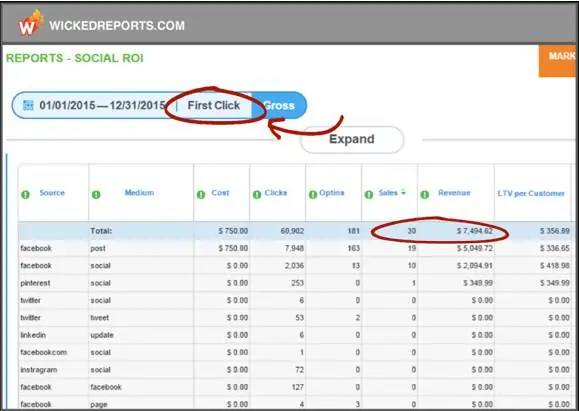
As you can see, the numbers above add up to 30 sales for close to $7,500. Of course, that may not cover the social media marketing spend, so that when you move on to…
First opt-in attribution – Instead of going back in time to find the very first click that led to a website visit, this looks at the click that led to a prospect subscribing to your emails.
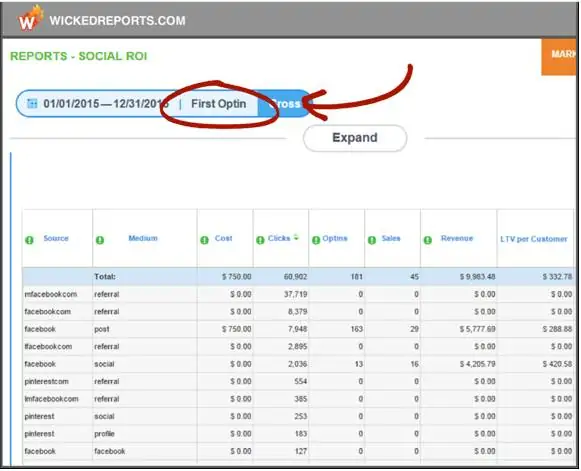
Again, 45 sales for a total of around $10,000 still may not be enough for some brands’ social spend. As well, the sales may have come from those already on the list who click on their social posts. To work around that conundrum, you can move on to…
Last engagement attribution – This measures every sale against the last time someone gave their email address after they were already on your email list to begin with. This basically considers the prevalence of retargeting, which makes this attribution model increasingly important.
Converting click attribution – If the above still doesn’t provide a clear enough picture, this report which looks back 24 hours to find the click to give credit to for the sale might.
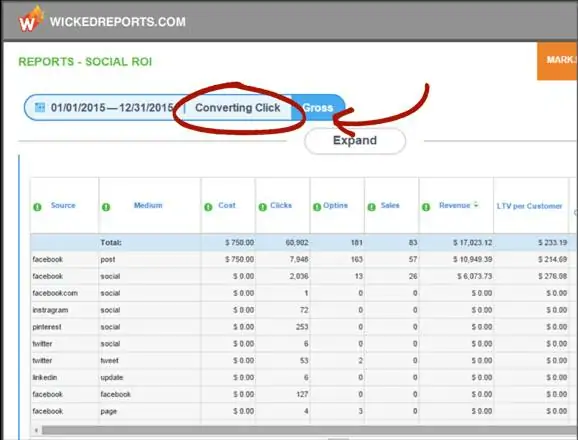
From these attribution models, you can get an idea of your social return. In this case, $5,819 in revenue came from a boosted post out of a total of $17,000, leaving around $11,000 from buyers that clicked on a social post and bought within 24 hours.
4. Track your social media metrics
Now that you’ve gained insight into the difference between vanity metrics and those that actually affect the bottom line, it’s important to note that those considered vanity metrics can still give you insight into certain aspects of your social strategy. Again, because you need a related metric for every goal you set out to accomplish, there are certain vanity metrics that will help you understand exactly how your social posts are performing.
For beginners, individual platforms’ native analytics can be a great starting point for tracking performance. For Facebook, that’s in the Insights tab; on Twitter, that’s in Twitter Analytics; while platforms like Instagram and Pinterest require you to have business accounts before you get access to your social analytics.
But because even these native analytics platforms can overwhelm you with a sea of social data, pulling from all those different sources can become too much for marketers and brands with less experience. That’s where taking the time to find social media analytics tools would be a wise choice. Not only will it save you time from creating reports from different platforms, some of them come with helpful visual reporting features that give you real value for money.
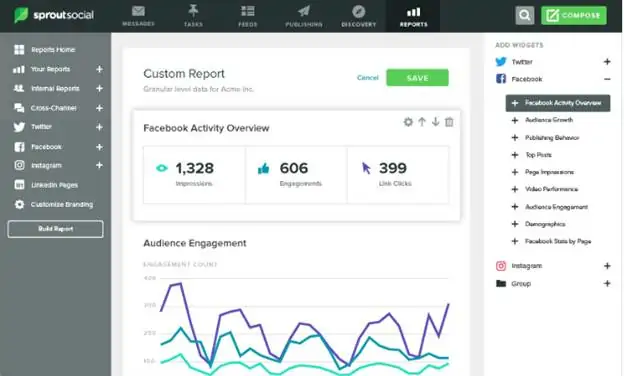
As you can see above, SproutSocial comes with presentation-ready social reports that you can filer by platform and date.
Tying metrics with goals
Engagement
Earlier, we touched on the importance of tracking engagement. But as you’ve also seen, there are a number of things that make up engagement, at least when you’re using native analytic platforms. So while looking at things like likes, comments, retweets, post engagement rates, and account mentions gives you an idea of how your social efforts are performing, looking at a combination of metrics will enable you to make educated decisions to meet your goals.
For example, if you’re just sharing an attractive photo of an influencer donning one of your products, it’s likely to get a lot of likes but not comments. And that’s not always a bad thing, because as in the above example, commenting wasn’t a call to action. Conversely, if a post encouraged comments and shares, then that’s another story.
Going back to SproutSocial’s tool, its Sent Message Performance report breaks down each post’s metric while also providing an average or total at the top of each column.
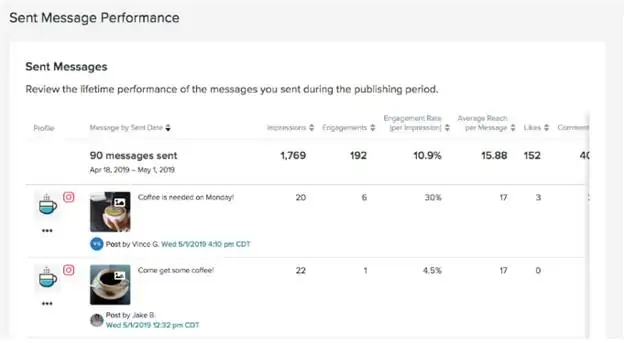
By playing around with this, you can identify which posts received the most impressions (that is, how many times your post showed up on people’s feeds), and which ones had the most users engaged. This will give you an idea of how to optimize your future content based on those that performed well.
Awareness
When it comes to awareness, impressions and reach are the two most commonly looked at metrics. While we’ve already briefly defined what impressions are, reach, for its part, is the potential unique viewers a post could have (this is typically your follower count plus accounts that shared the post’s follower counts).
To truly work on awareness, you should set a goal of increasing reach and impressions, while also educating your audience as this encourages engagement.
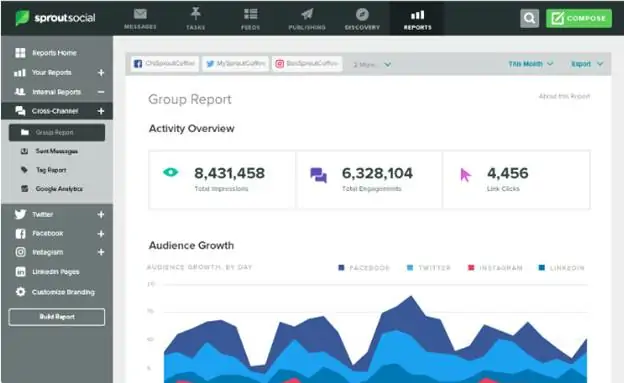
Share of voice basically indicates how much of the online sphere your brand is taking part in. So if you’re a motorcycle gear retailer in Los Angeles, it would reflect how many people are talking about your brand online relative to your competitors.
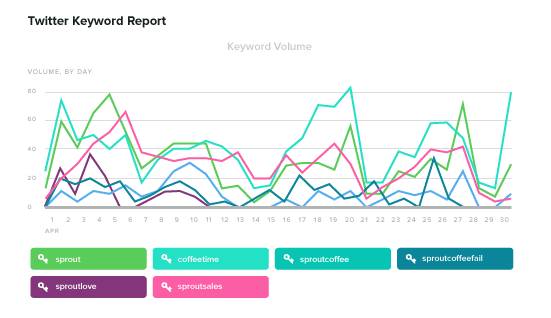
Sticking with the same tool, for now, SproutSocial’s listening features give you insight into the volume of discussion for certain keywords. When you combine that with a Trends report, you can see what words are most frequently associated with your brand. Essentially, this shows you where your brand can improve and which you can utilize to capture more attention.
Building relationships
It’s understandable that most of the focus would go into the performance of social posts. But because one of the main reasons for establishing and maintaining a social presence is to build relationships with your customers, you should also be monitoring response rate and time. This metric basically tracks how fast your social team is responding to your audience’s messages and how many of them are actually being responded to.
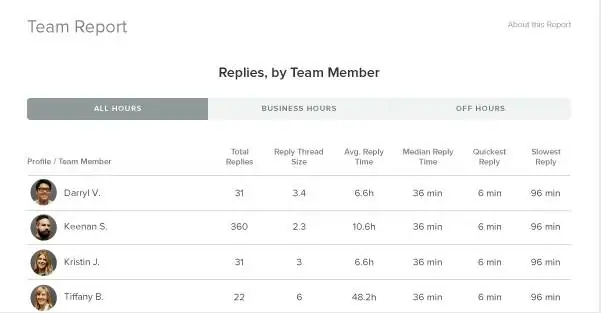
As you can see above, some tools even have detailed reports on these for each team member.
Recommended social ROI tools
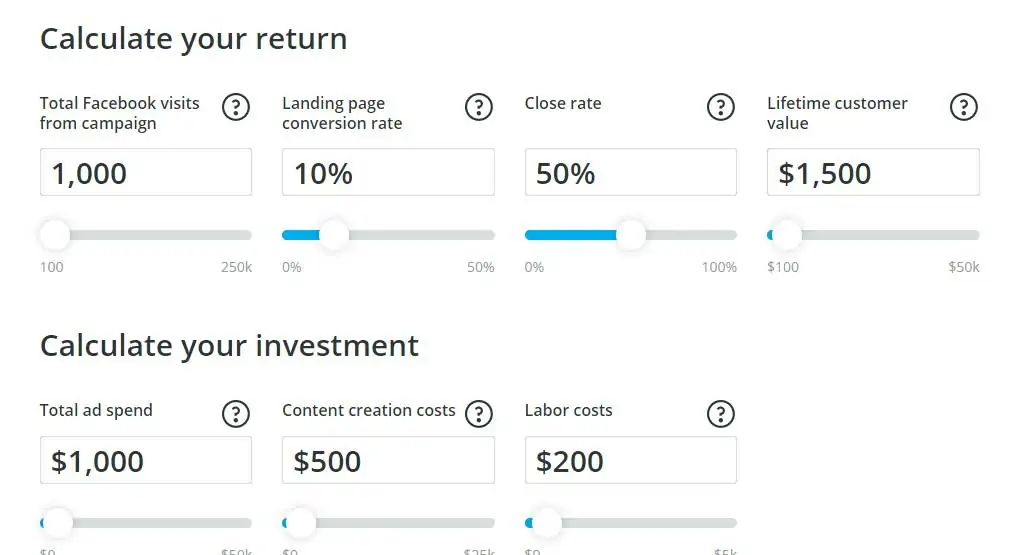
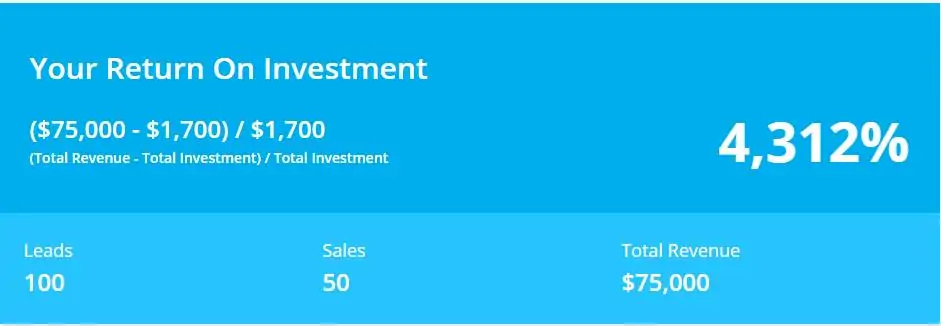
Social ROI calculator – Hootsuite’s tool takes care of the math for you, taking all your data and turning in a report that you can understand at a glance.
Google Analytics – Apart from letting you track website traffic conversions, and signups from social media, this tool also does the following:
• Tells you which social media platforms give you the most traffic.
• Allows you to set goals.
• See what content works best with individual social platforms.
• Ensures that you’re pulling from the right social demographics.
• Shows how many sales conversions your business gets from social media.
• Calculates the ROI of your campaigns.
Hootsuite Impact – This tool syncs with your existing analytics systems, which allows you to integrate social data with the rest of your business metrics. It can measure the ROI of your social platforms across paid, owned, and earned social channels and makes producing reports seamless, while also delivering straightforward recommendations on how to optimize your social strategy.
Facebook Pixel – This piece of code for your website enables you to track conversions from Facebook ads – consolidating everything from leads to sales.
UTM Parameters – When you add these collection of short text codes to your URLs, you’re able to track important data about website visitors and traffic sources. What’s good about this tool is its able to work with analytics platforms like Google Analytics, giving you a more comprehensive view of your social performance.
5. Assign monetary values to your KPIs
Where social ROI gets tricky for most marketers is in assigning monetary values to your KPIs. But it doesn’t have to be. Here are some of the methods you can try to see which works for you best:
• Lifetime value – This is basically how much you earn on average from each customer.
• Lifetime value x conversion rate – This is how much each potential visit is worth to you based on the percentage that converts.
• Average sale – The average purchase on your site.
• PPC valuation – How much you would end up paying if you were to use ads to achieve the same social results.
To help illustrate this, take what Zoomcar – an Indian car rental company – does. It uses its social media presence to drive mobile app installs, where users can avail of their services. Because it knows that the lifetime value of its customer is $70, and that 40% of its mobile app users make a purchase, they also know that a mobile app download is worth $28. This knowledge allows them to make informed strategic decisions.
Of course, Zoomcar probably had historical data to bank on when determining a customer’s lifetime value. If you don’t have that yet, you can guesstimate with the help of common sense and experience. For example, if a prospective agency promises 1,000 signups to your emails in three months, how much are you willing to pay per signup? You can start with that value and revise it later on when you have enough hard data.
Additionally, Buffer’s studies found some benchmarks that could help you for comparison.
• Facebook like average - $.50 per page like
• Facebook reach average - $.59 per thousand impressions
• Facebook click average - $.50 per click
• Promoted tweet - $3.50 per thousand impressions
• LinkedIn - $2 per click
6. Calculate the ROI per social media channel
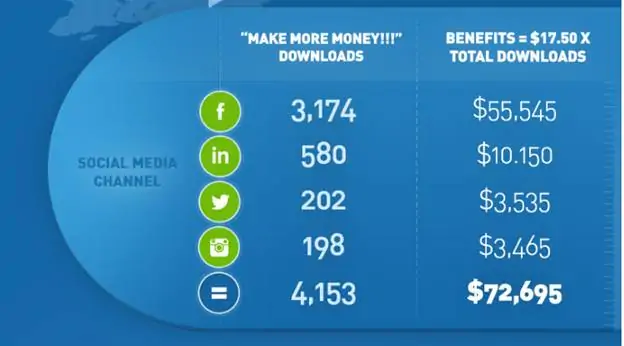
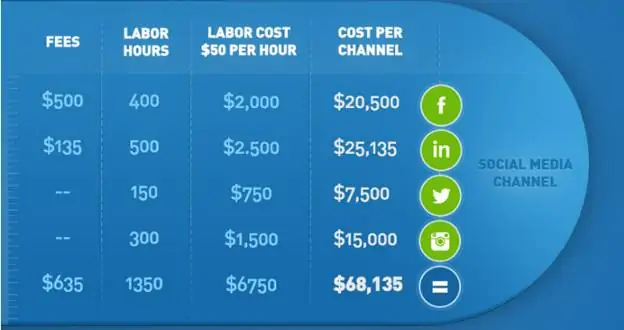
The first step in calculating each channel’s ROI is measuring each’s total benefits. You can do this by collecting incoming traffic and conversion data from your analytics tools. Then, you can create a spreadsheet that correlates that data to the assigned total monetary value of those conversions.
Below is an example from Buffer where a download was valued at $17.50.
Then, determine the total costs per channel by adding up promotional account spend, labor costs, and sundry costs. Using the same example, below was how this looked.
Once you come up with your own numbers, you can use the simple formula: Benefits – Costs x 100 / Costs = Percentage return on investment costs (ROI).
Again, the same examples from above, that amounts to:
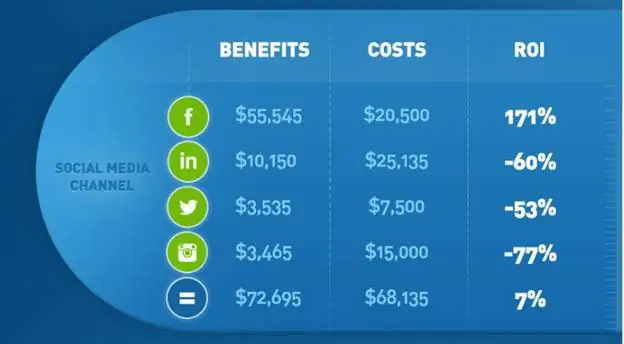
7. Analyze results
At this point, you should analyze your ROI per channel to adjust your strategy accordingly. For example, if you find that Twitter has a lower rate than both Facebook and Instagram, you might want to reconsider your resource allocations on Twitter – or even scrap it from your campaign altogether to allow you to focus more time and resources to the channels that are performing.
Of course, a net positive on all channels would be a dream for most brands. It’s fairly common to see the costs far outweighing the benefits, particularly when brands choose to do their own social media management in-house. So while all channels might meet the targets set, the additional costs of hiring a social media team might offset all that net positives. In this hypothetical case, it might be more cost-effective to outsource social media management to an agency.
And when you find certain elements going in different directions like, say, getting a lot of leads but eventually finding they aren’t qualified, you can resort to split testing. In this example, you can split test lead generation campaigns. Split testing is integral to the success of most marketing endeavors. Social media marketing is no different. Even when you achieve a net positive ROI in all your channels, testing can sometimes show you ways and avenues where even what’s considered a success can be further improved upon.
Additionally, you can also benchmark your results against your competitors’ to see how well you’re doing in your industry. This can give you added motivation and insights into what you can do.
What is a good social media ROI?
Speaking of benchmarking the market, this is what’s going to help you identify what a good social media ROI is. You can start by comparing your social media marketing spend against your competitors. This allows you to get an overview of the budget their putting into their social efforts, and the kind of value they’re generating from it.
Of course, your competitors aren’t going to giftwrap this kind of data for you. Fortunately, SocialBakers’ Social Media Benchmarks tool shows you exactly what it’s named after. It provides you with day-by-day data on how the market is moving along to the tune of social algorithms and audience behaviors.
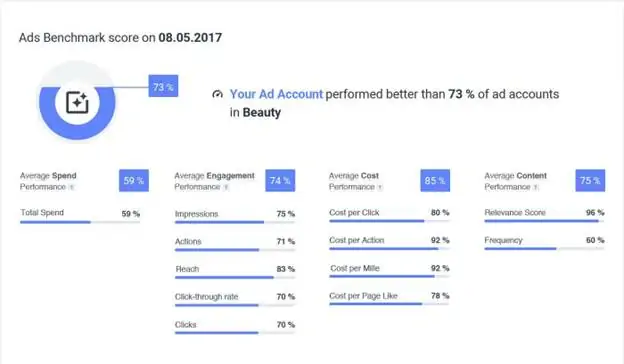
Additionally, you’re going to want to regularly check your Facebook Relevance Score as the social media giant’s platform is always in a state of flux. From its advertising landscape and algorithm changes, to seasonal campaigns and new brands entering the market, a lot of moving parts can impact your revenue.
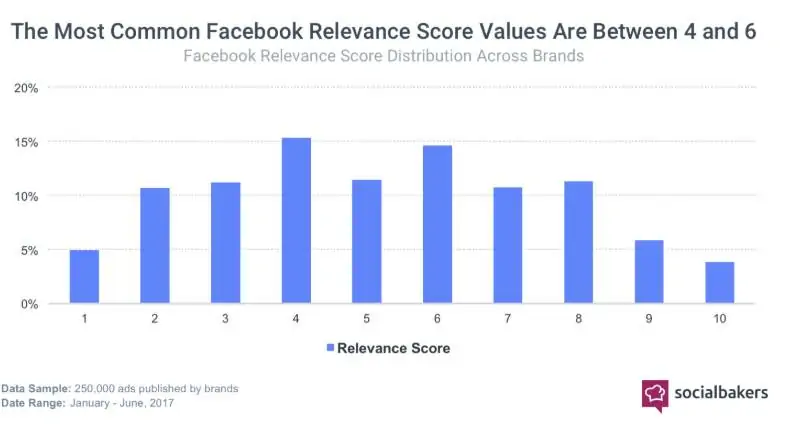
According to SocialBakers, most businesses will fall between the ranges of 4 to 6 in their relevance scores. But of course, if you want optimal revenue, you’re going to want to strive for a higher score. That’s where keeping your finger on the pulse of the Facebook landscape comes in.
Case studies that prove social ROI
For a seasonal campaign, the company pivoted its ad spend from TV to Facebook. The campaign invited people to “Have a fling with Crème Egg” on Facebook, creating a three-month series of one-off posts that fed into an overall narrative.
The Facebook campaign matched TV in driving brand consideration for just a third of the cost, while also increasing sales by 7%.
The skin care company used Snapchat to help raise awareness among females aged 13 to 24 for its Morning Burst facial cleanser. For their campaign, Clean & Clear ran animated Snap Ads targeted to reach the right people at the right time. They used Snapchat’s Lifestyle Categories to help optimize their Snap Ads between Stories and Filters campaign to reach Snapchat users most likely to be interested in skin care.
The Snap Ads and Filters campaign generated an 11.2% lift in aided awareness (a number that was 5.5X higher than Millward Brown Norms), as well as a 7% increase in favorability – 3.5x higher than their competitor.
The company redirected around 600,000 contacts per year through social media instead of its call centers. The pivot saved the British company £2 million per year, while also improving customer experience. They found that their customers preferred to deal with British Telecom via social media instead of through phone or email.
The company used shopping basket data to identify competitor products their own loyal customers were buying. They found that though their customers were loyal, 75% of them were only buying Neutrogena items within a single product range of the company, opting for competitor products that they also had a range for.
To address this, they created a “product pairings” campaign delivered through video, banner ads, and coupons – all designed to drive sampling. They targeted consumers based on their personal buying habits. The campaign resulted in an increase in sales with 18.1 million households reached and a £5.84 return on advertising spend. As a point of comparison, a good benchmark for ROAS is 4:1.
After noticing that a lot of people were asking about social payments, they looked into the prospect of integrating the system by coordinating with their IT and accounts teams to see if it was feasible. After designing their own social payments tool, which cost €3,500 to set up, the new payment system now takes €80,000 per week in sales.
Next steps
Keep in mind that there’s always room for improvement. Don’t fret if you find your results to be lagging behind your competitors. The important thing is that you’ve begun to get an understanding of the type of return social media can have on your business. This allows you to consistently work on tweaking your strategies to improve your social ROI. Of course, to get started with that, you’ll need to get good at understanding the results of your campaigns.